Es 2_Italgaz_M.Deschepper_T.Lacour-Veyranne
In this delivery we have studied the solar radiation on the spaces, the facades and the glass surfaces of the buildings in order to value positive and negative aspects.
We share below the procedure followed to continue modeling through the definition of particulars on the facade and to do a more accurate solar analysis.
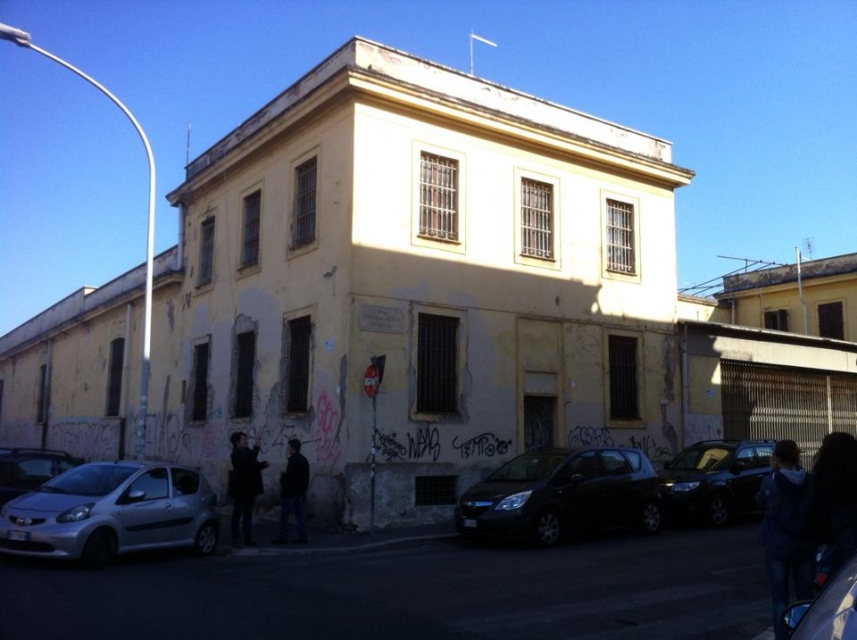
Step 1: Drawing the ground floor
Once you have created the masses that represent the buildings, now create the ground as a simple parallelepiped, which the volumes are based on. Do this in order to analyse, later, the solar radiation on the open spaces defined by the buildings.
Step 2: Drawing the details
In order to add a building’s details, click on MODIFY MASS > EDIT IN PLACE.
Be sure to set the right work plane, draw the figure that you want to represent: you can move it and also adjust the dimensions by clicking on them.
Click on CREATE FORM > VOID FORM and extrude towards the interior with the chosen measure.
Once you have realized all the details, to complete the modeling click on FINISH MASS
Step 3: Set the solar analysis
Click on ANALYZE > SOLAR RADIATION > SETTINGS to set up all your preferences of analysis.
- First, select the facades you want to analyse.
- Then, set the period of the analysis (Multy Day > Summer Solar Study or Winter Solar Study) and check location, date and time.
- In DATA DISPLAY, set the type (Cumulative), the unit (KWh/m2) and the style of the analysis. You create a new style, or you can modify the default styles (for example “Ecotect style”).
Step 4: Our solar analysis of the open spaces
We’ve thought that the best way to analyze the radiation on the buildings is choosing the hottest hours of the day during the most significant and different seasons of the year, winter and summer.
Summer and winter solar study
We have analyzed how many radiations our building (a) and the near ones accumulate, in order to observe if the exposition is useful for a comfortable livability of the open spaces. What we observed is that, due also to its width, Via di commercio receives a lot of solar radiation during this period: this might be a problem during summer, because the high temperature of the asphalt can seriously influence the temperature at the street level.
Summer
Winter
We have considered significant to analyse also the courtyard of the building we called b and the way its internal facades accumulate the solar radiation: we observed that the two facades exposed to South-East are a lot more radiated than the ones exposed to North-West; also, inside the courtyard there isn’t any tree that could cast its shadow over the walls, so probably the South-East facades become pretty hot during the days of summer.
On the other hand, during winter not only the North-West facades receive little radiation, but also the first floors of the South-East facades, so the interior might result pretty cold.
South-East facades, summer
South-East facades, winter
Focusing on our building, we have analysed the North-West facade (the one on Via di commercio) and the South-West facade (on Via di porte fluviale): we can notice that, both in winter and summer, the first one is not really radiated because of its exposition; the balconies are very little radiated, because they are not projecting but are arrears in the volume, and also the shops’ windows on the ground floor receive little radiation because of the overhang above them.
Otherwise, the South-West facade is a lot more radiated: during summer, despite the floors of the balconies are really sunny (about 160Kwh/mq), their inner walls seem to be well shielded; during winter, the portion of the facade arrear from the road is a lot less radiated than during summer, because of the shadow of the nearby wall and of the frontal tree.
North-West facade, summer
North-West facade, winter
Step 5: Our solar analysis of the glass surfaces
Click on ANALYZE > SOLAR RADIATION > SETTINGS to set up all your preferences of analysis:
- First, select the glass surfaces you want to analyse.
- Then, set the period of the analysis (Multy Day > Summer Solar Study or Winter Solar Study) and check location, date and time.
- In DATA DISPLAY, set the type (Cumulative), the unit (KWh/m2) and the style of the analysis. Create a new style setting as display stileMarkers with text and giving it a name (“Numerico lab6”).
You can now modify settings, colour (max = red, min = blue) and legend of your new style.
It’s possible to change the density of the numeric indicators of the radiation by setting the “Analysis Accuracy” or to change the display scale in case the informations on the model result too big .
PART 2
1. ANALYSIS OF THE PROJECT'S AREA
Our project is located next to the italgaz district of Rome, ostiense , near piramide station , on the est side of the Tevere and in the South of City.
First of all, we have analyzed the shadows of the buildings around our area without the hypothetical project inside, to understand how much sun it receives during the two most significant and different moments of the day.
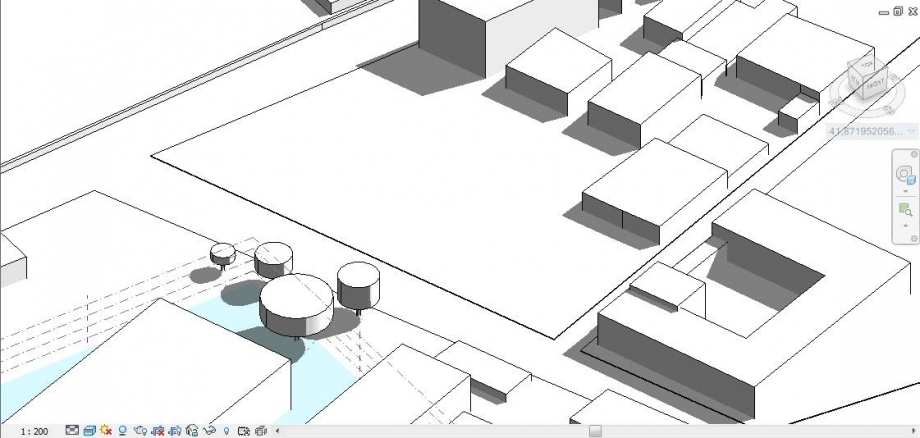
9H00
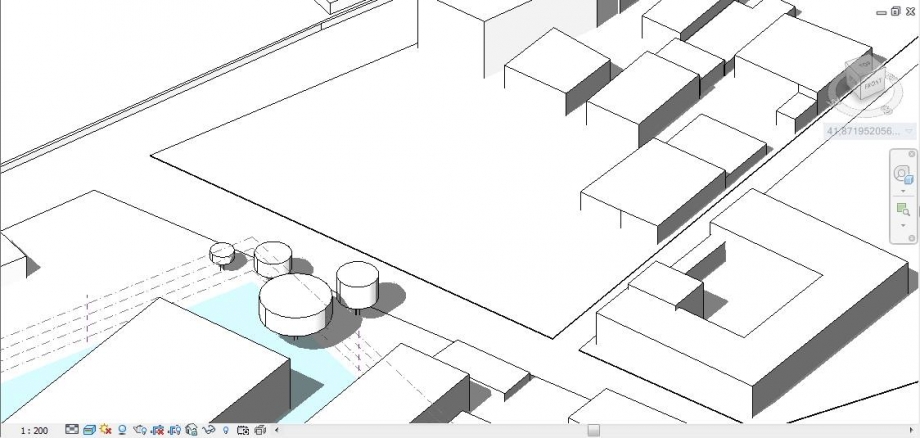
12H00
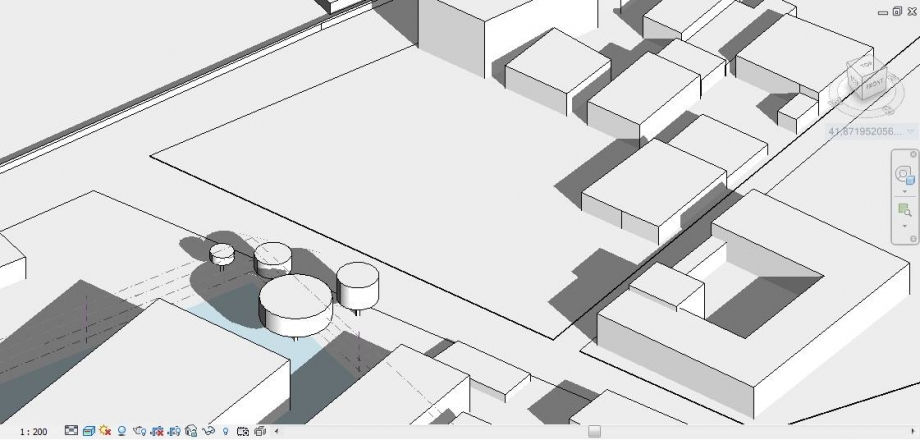
15H00
- Our idea about our project
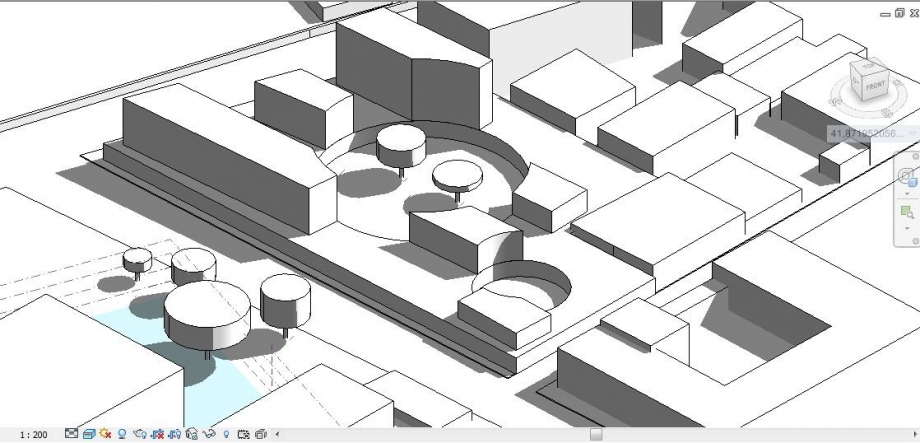
9H00
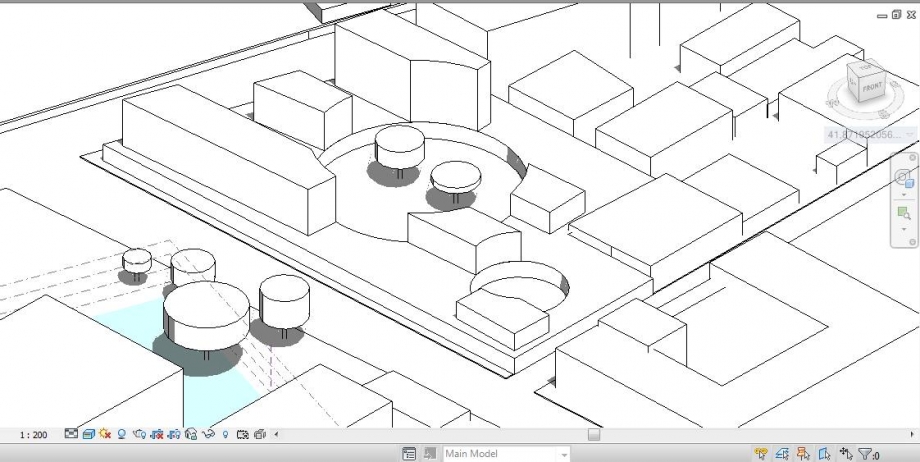
12H00
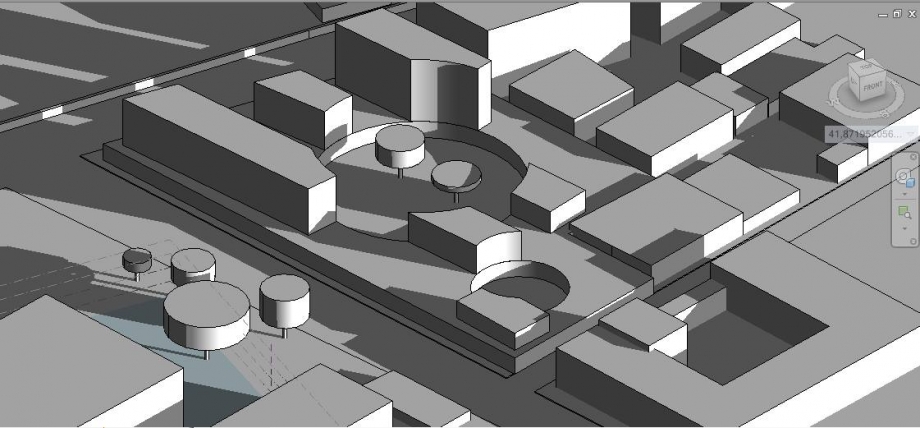
15H00
Software Tags:
Student Tags:
Media Image:


