


Shading Analysis - Circonvallazione Ostiense 154 work in progress
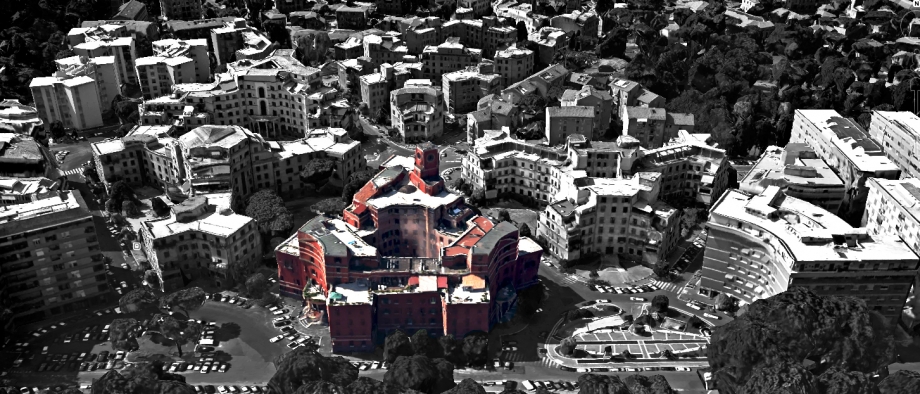
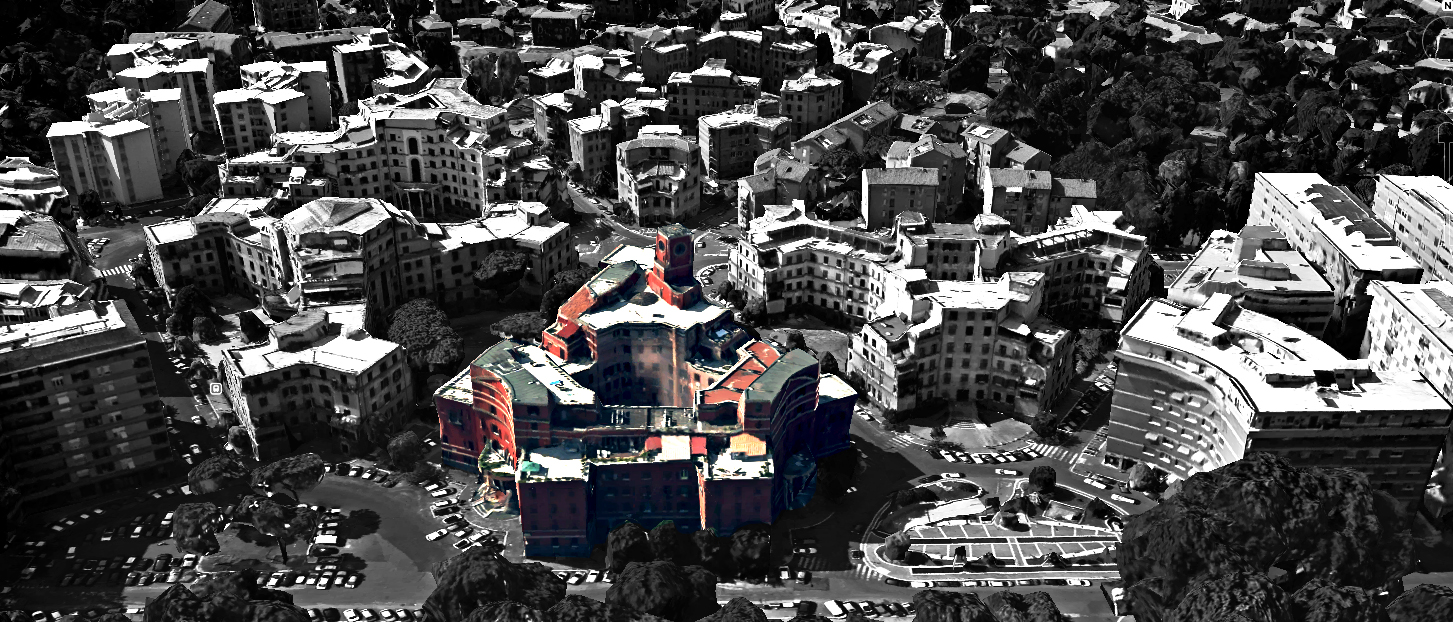
The Area that we considered is Garbatella in the south area of Rome. The zone is mostly residential with constructions about four to six levels tall.
Our selected Building is part of a complex.
In this first exercise we analyzed the behavior of the sun and the generated shadows at different hours and seasons . Each calculated for the summer, winter soltice and spring and fall equinox at 9am, 12pm and 4 pm.
We noticed that there are no excessive shading from the neighbouring Buildings that reflect in our facades, so decided that since our structure has a very complex form we will wait for the next updates to see how much the different hights will affect the situation.
During this past week we couldn't make it to take fine pictures of the building, caused of the bad weather conditions. We were looking for some interesting situations so that we can consider the surrounding buildings relevant.
Till now it wasn't possible so we hold up and hope to consider and involve more specific details that characterize our building in our next deadline.
This was the procedure we used to build the model using Vasari, we will assume that the reader has a basic knowledge of the program interface.
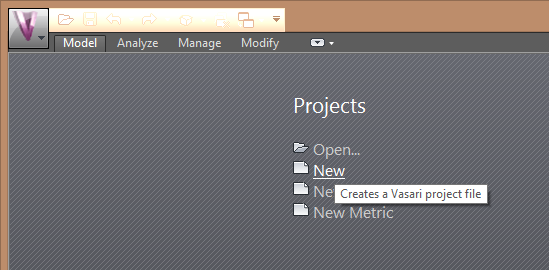
We started by opening a new project in Vasari.
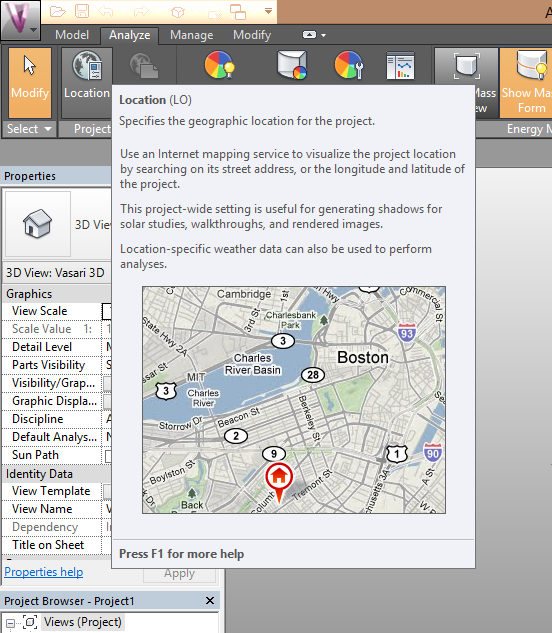
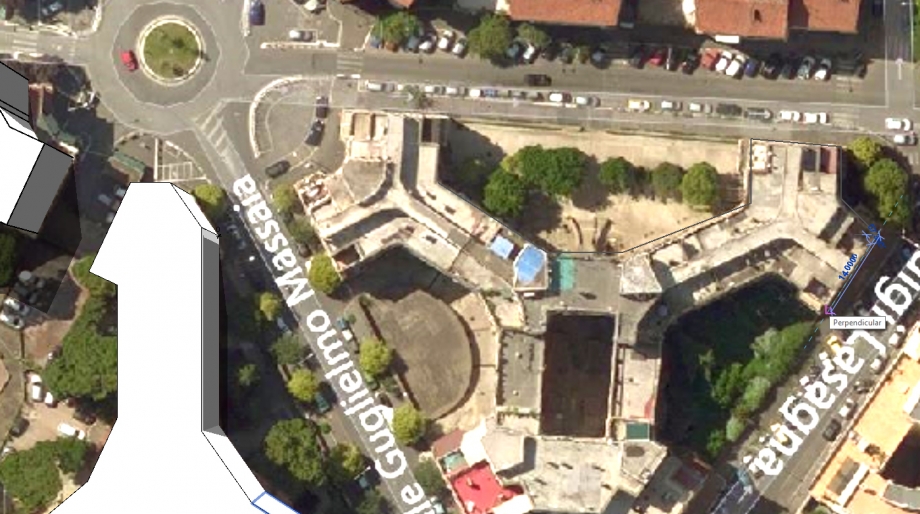
We inserted our location by clicking on "location" in the Analyze Pan.
Next steps were short done, we selected the right weather station and exported the right image to retrace the location.
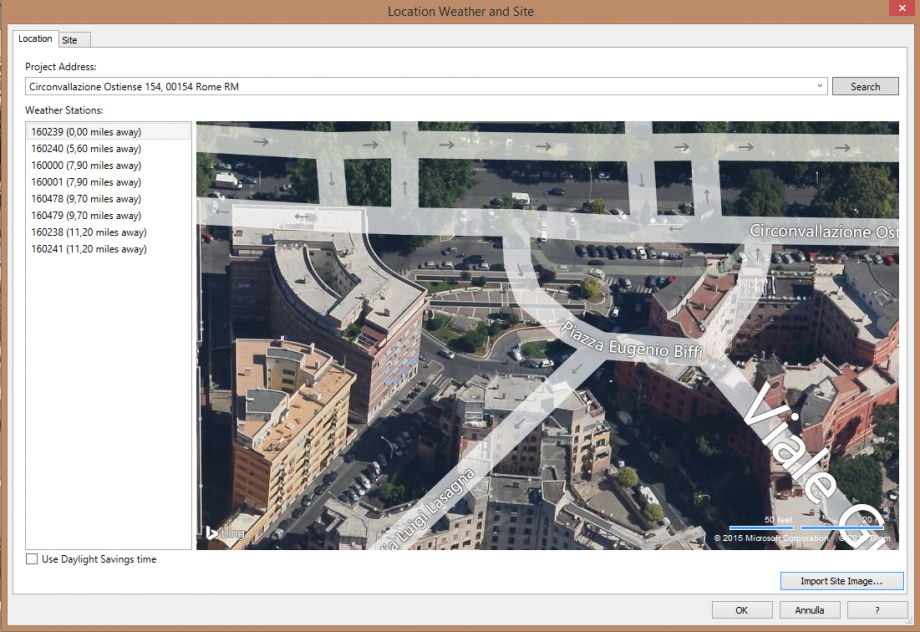
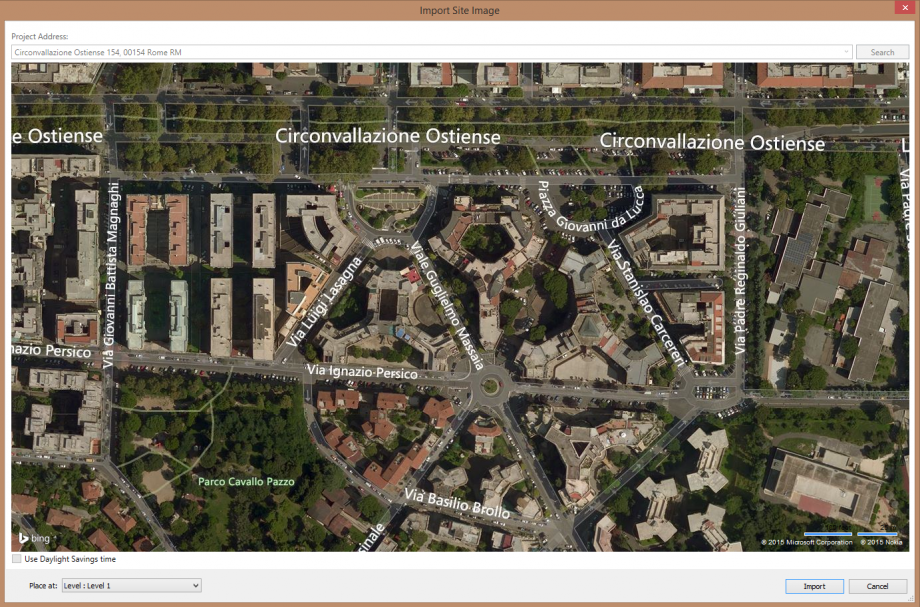
We can see that the entire area shows a very precise and planned urban design configuration, so we were looking for an effective result while analyzing the shadows.
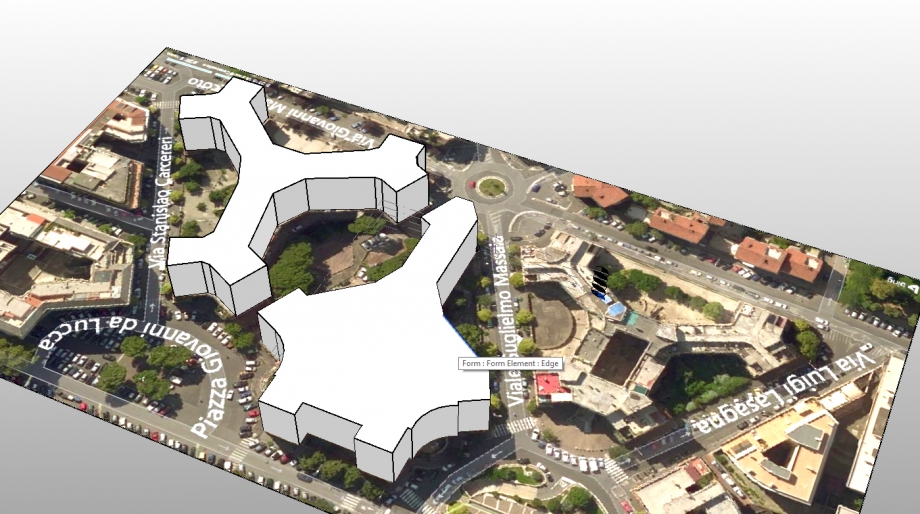
In a second step we started a basic drawing, showing the main shapes of the constructions close to the one we considered to study.
We accessed to the drawings tool by clicking on the model pan the "create mass" button.
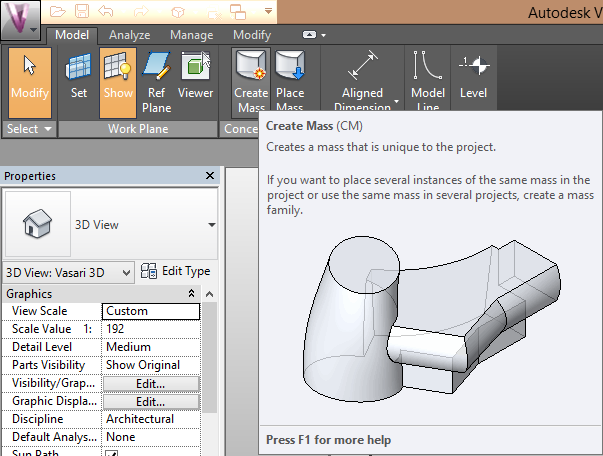
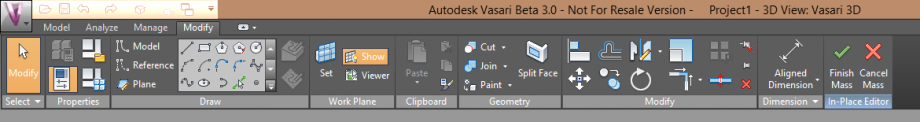 Since the interface of the drawing tool bar is very familiar with the one from Autodesk we were immediately confident with the tool and continued the tracing proceeding
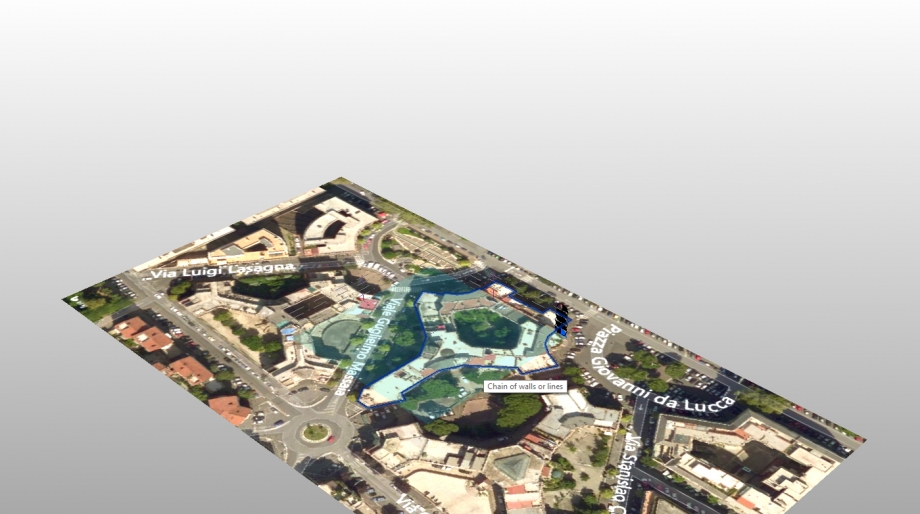
The blue line represents the edge of our building while the blue square is the plane were we are drawing.
 We extruded the shapes of the building by clicking on "create form" and setting an hight of 3 meters for every floor.
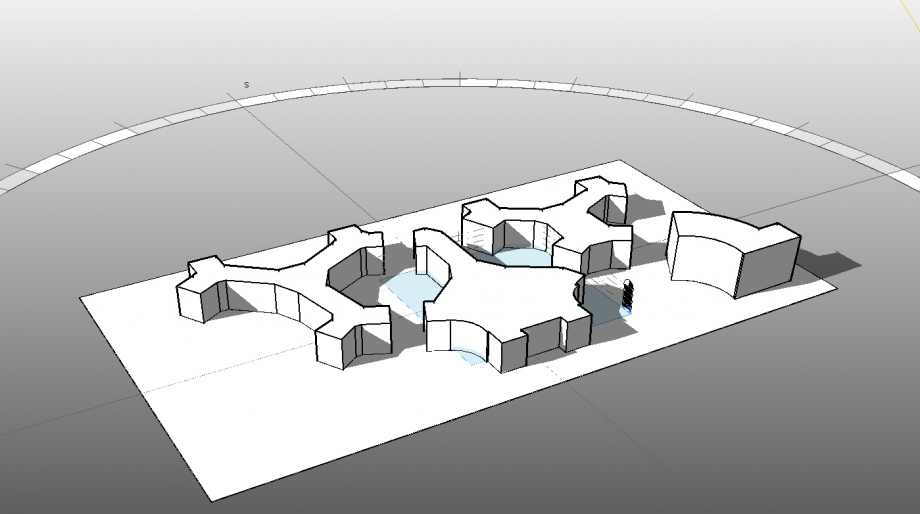
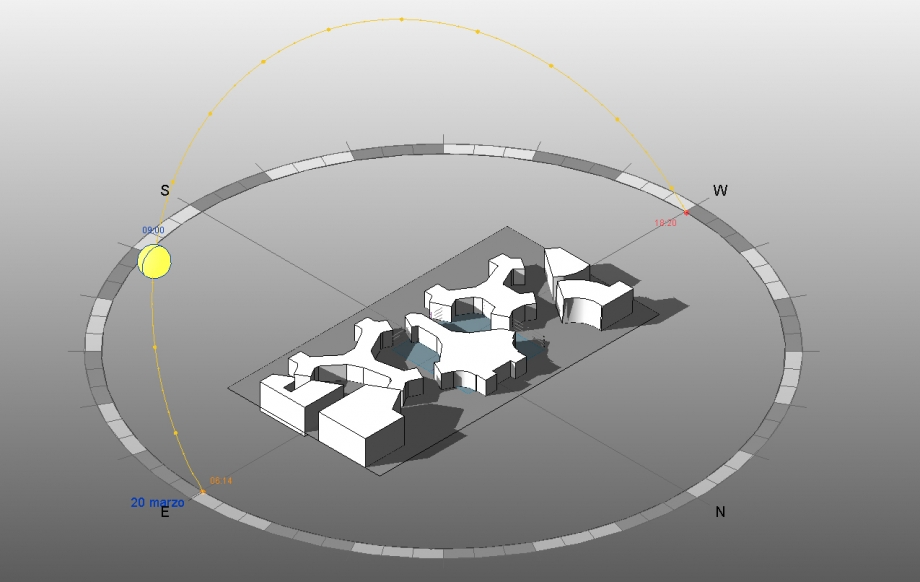
n conclusion our model is similar to this one. In this image we can see the circle which represent the goniometer of the sun path route.
In fact we started visualizing the shadows so that it was possible to make some consideration about the building and his surrounding area.
this is a graphic analysis that shows a north-east isometric view of the reaction during the different periods we mentioned above.
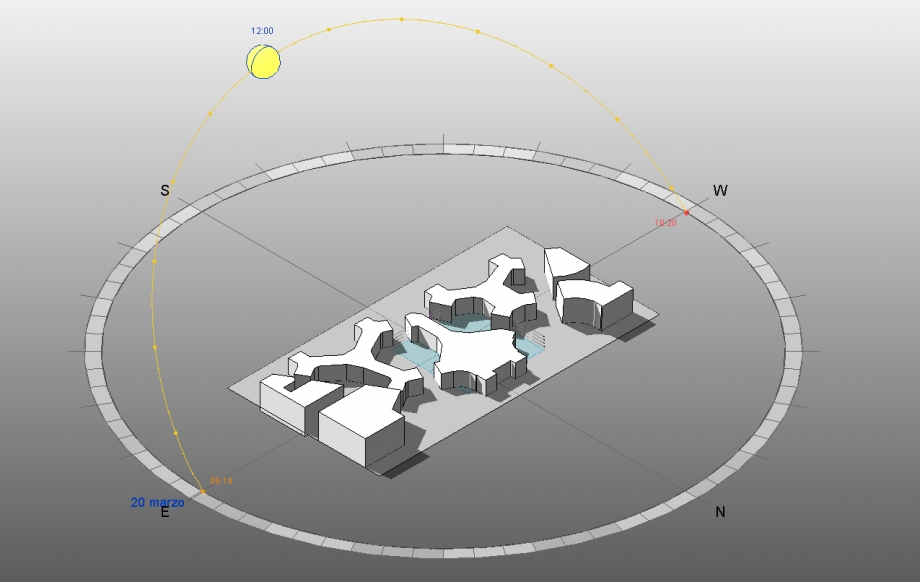
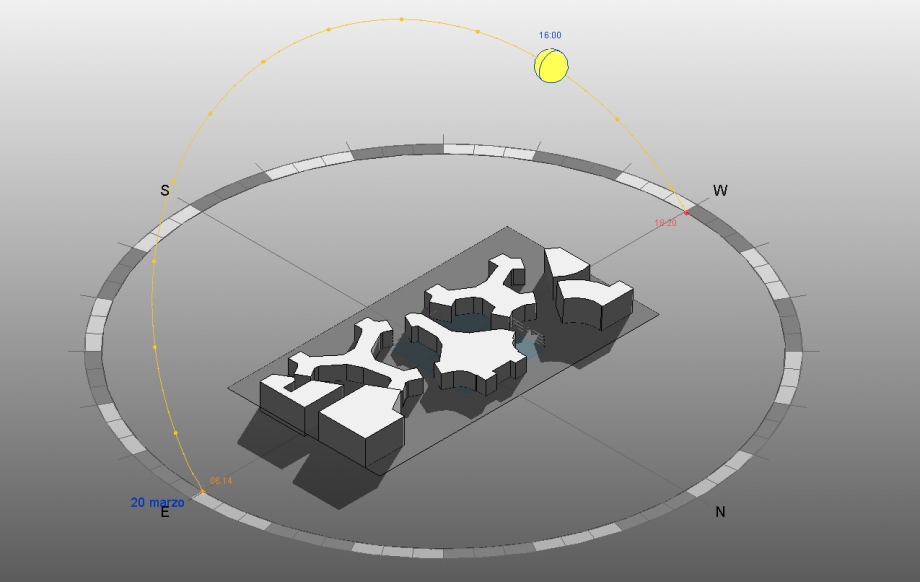 Spring Equinox
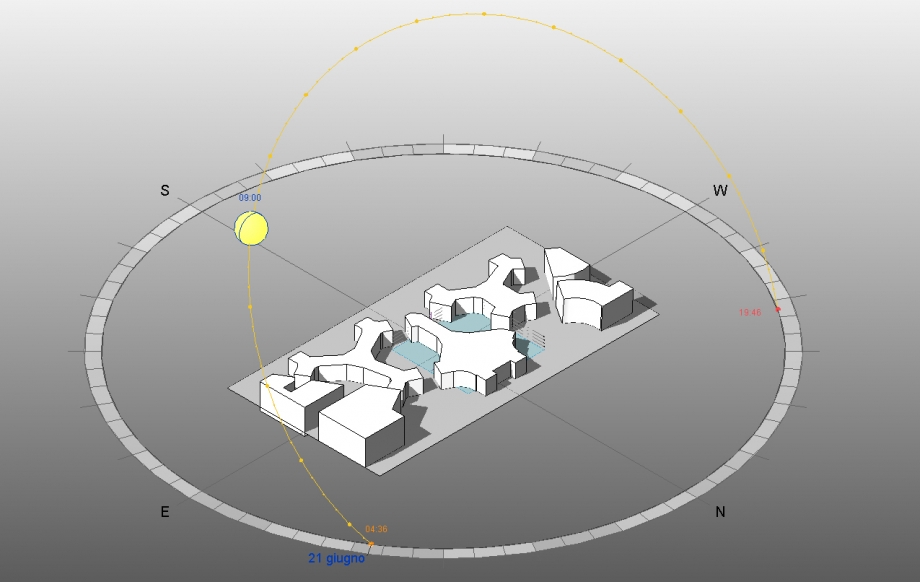
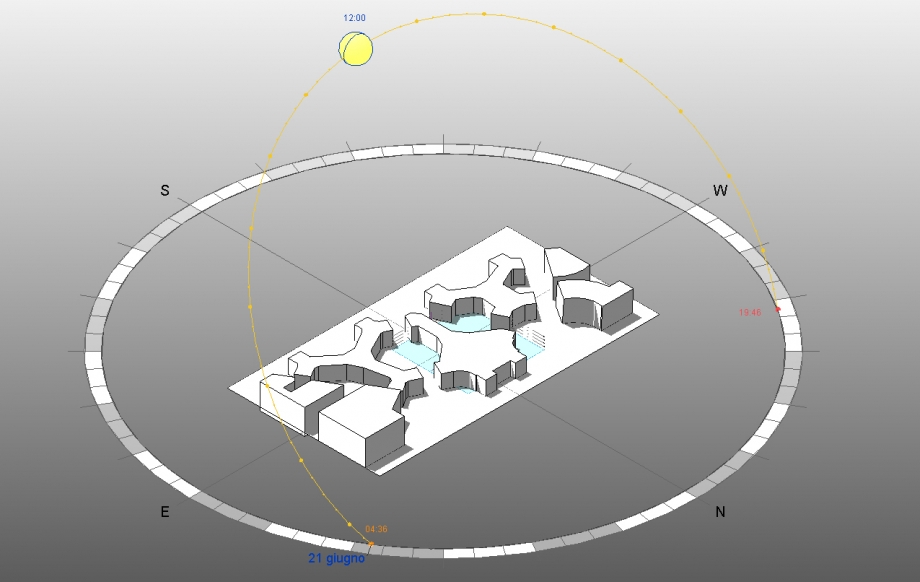
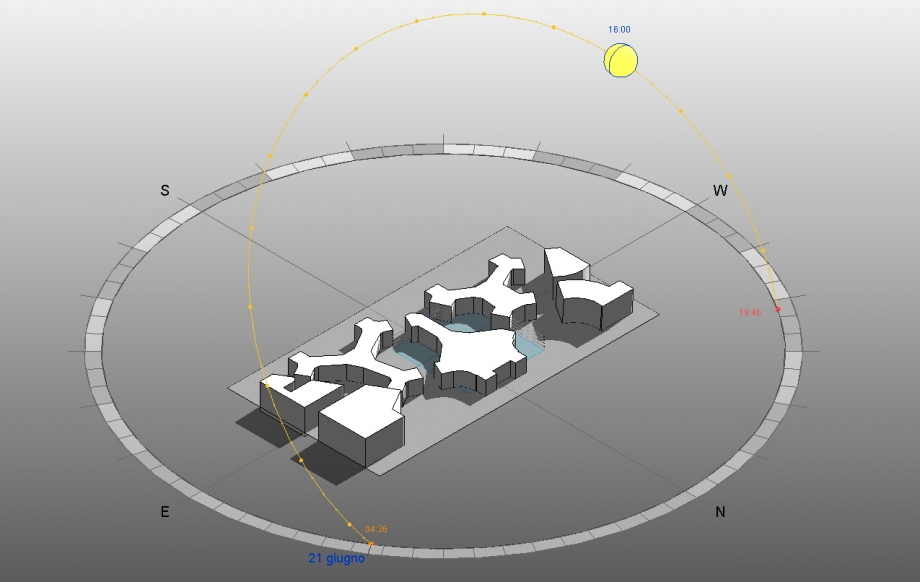 Summer Solstice
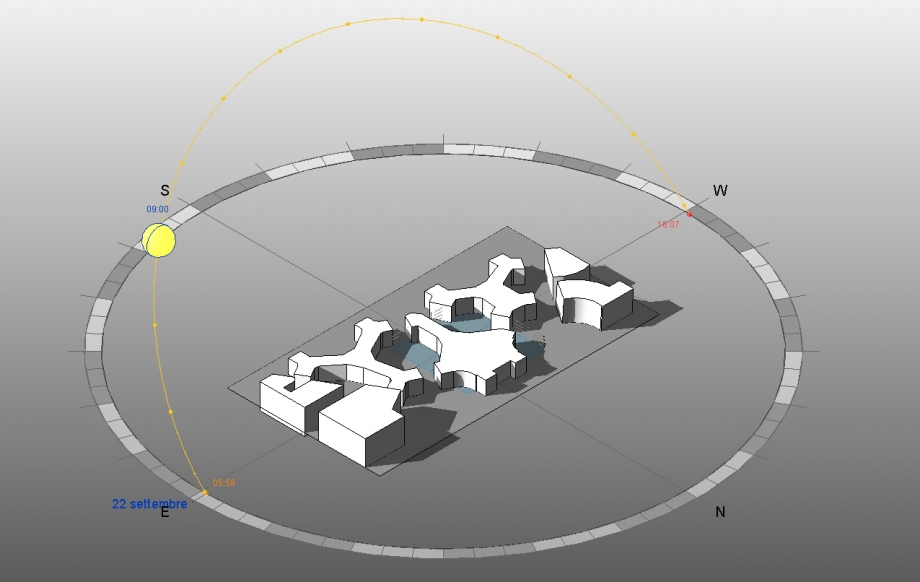
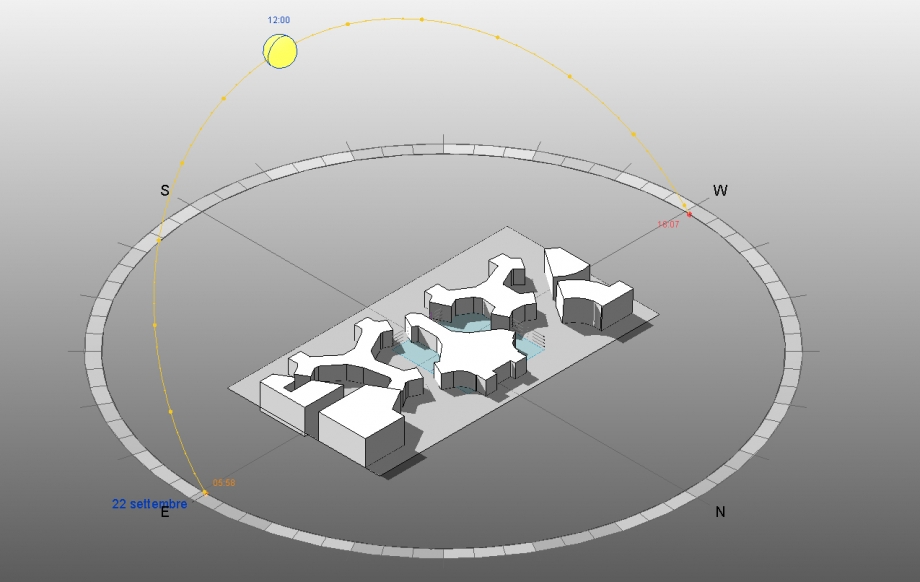
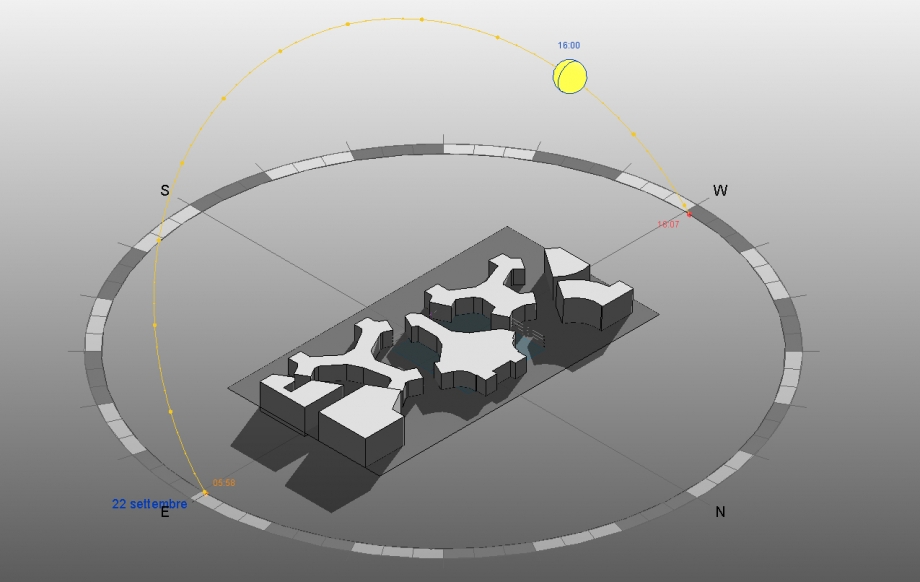 Fall Equinox
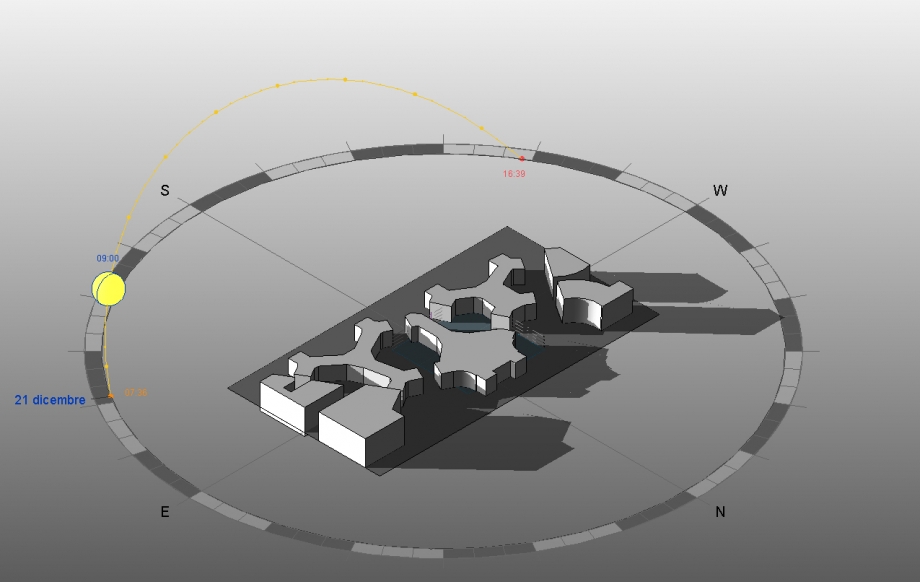
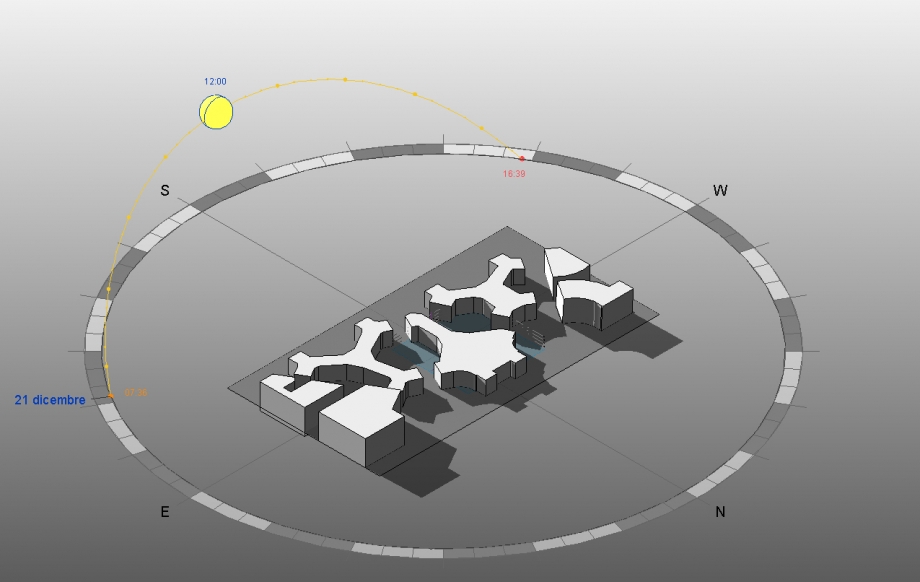
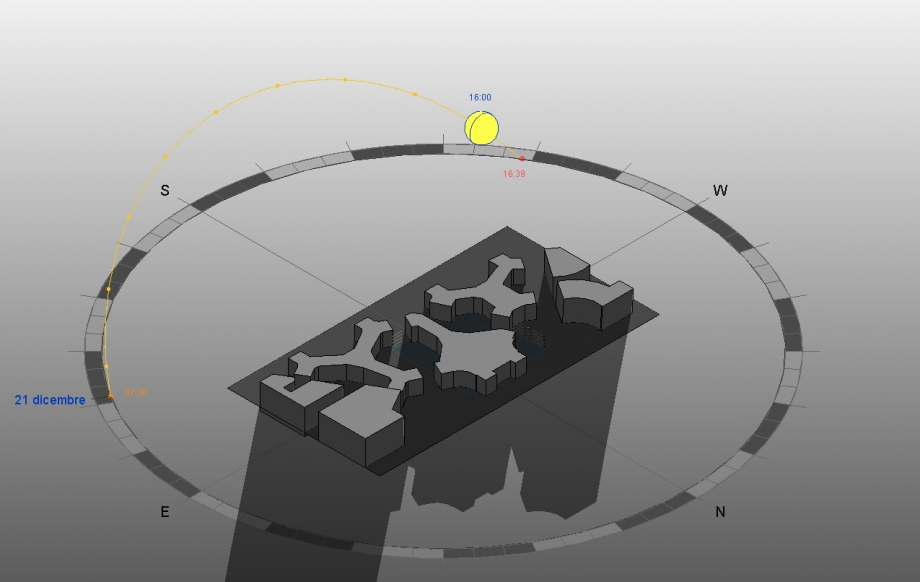
Winter Solstice.
Even though we weren't able to compare the model with some pictures of our own, we used google maps to see if the program was actually working by comparing our shadows with the ones in the pictures.
This photograph was taken in June, probably in the morning.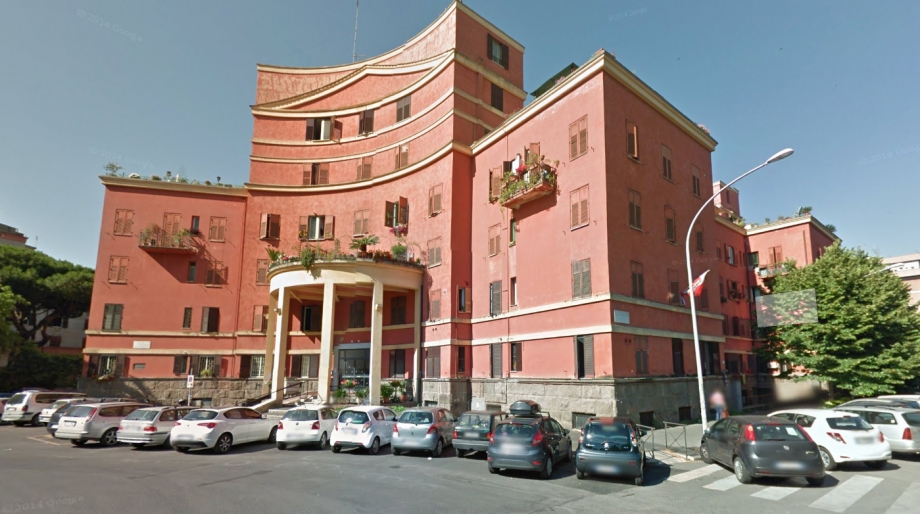 So, if we compare the shadows in this pictures we can see that they are really close to what represent the picture of june 21th.
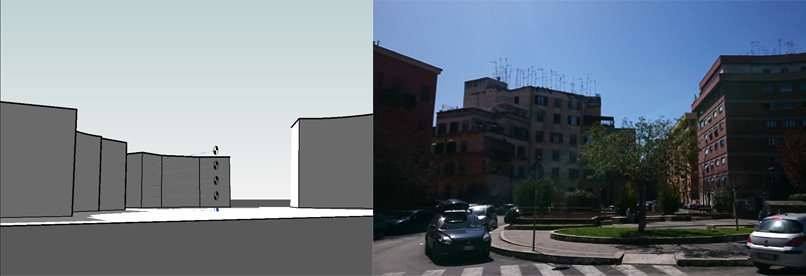
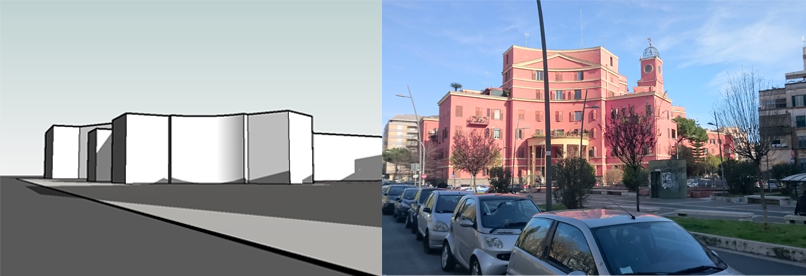
We tried then to compare the analysis on the facades with real photos and if there are actually some matches.
The curvature of the facades allows a constant and often exposure of the sun.
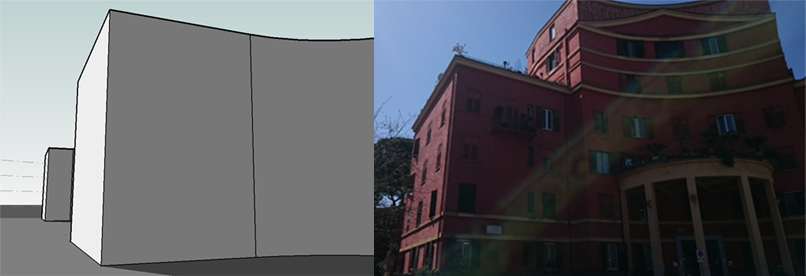
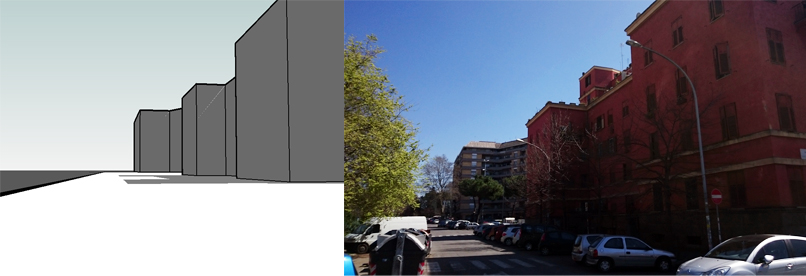
Also the distance between the buildings is designed to allow a minimum constant shading towards each other .
In this way there are creating some protected areas between the arms of the buildings .
Commenti
D'Addario_Klainguti
Lun, 30/03/2015 - 01:19
Collegamento permanente
.
.
D'Addario_Klainguti
Lun, 30/03/2015 - 01:19
Collegamento permanente
.
.
D'Addario_Klainguti
Lun, 30/03/2015 - 01:20
Collegamento permanente
.
.
D'Addario_Klainguti
Lun, 30/03/2015 - 01:20
Collegamento permanente
.
.
D'Addario_Klainguti
Lun, 30/03/2015 - 01:21
Collegamento permanente
.
.
D'Addario_Klainguti
Lun, 30/03/2015 - 01:21
Collegamento permanente
.
.
D'Addario_Klainguti
Lun, 30/03/2015 - 01:18
Collegamento permanente
.
.