before ADDIS - Preliminary Analysis of Climate using Ecotect
Come primo step progettuale ho ritenuto importante conoscere il clima dell’area di progetto (Addis Abeba, Etiopia) per adottare sin dal principio le giuste strategie energetiche. Ho deciso di intraprendere questa parte conoscitiva utilizzando il software Autodesk Ecotect.
As a first design step I thought it was important to know the climate of the project area (Addis Ababa, Ethiopia) to adopt already from the beginning the right energy strategies. I decided to undertake this part of the learning using the software Autodesk Ecotect.
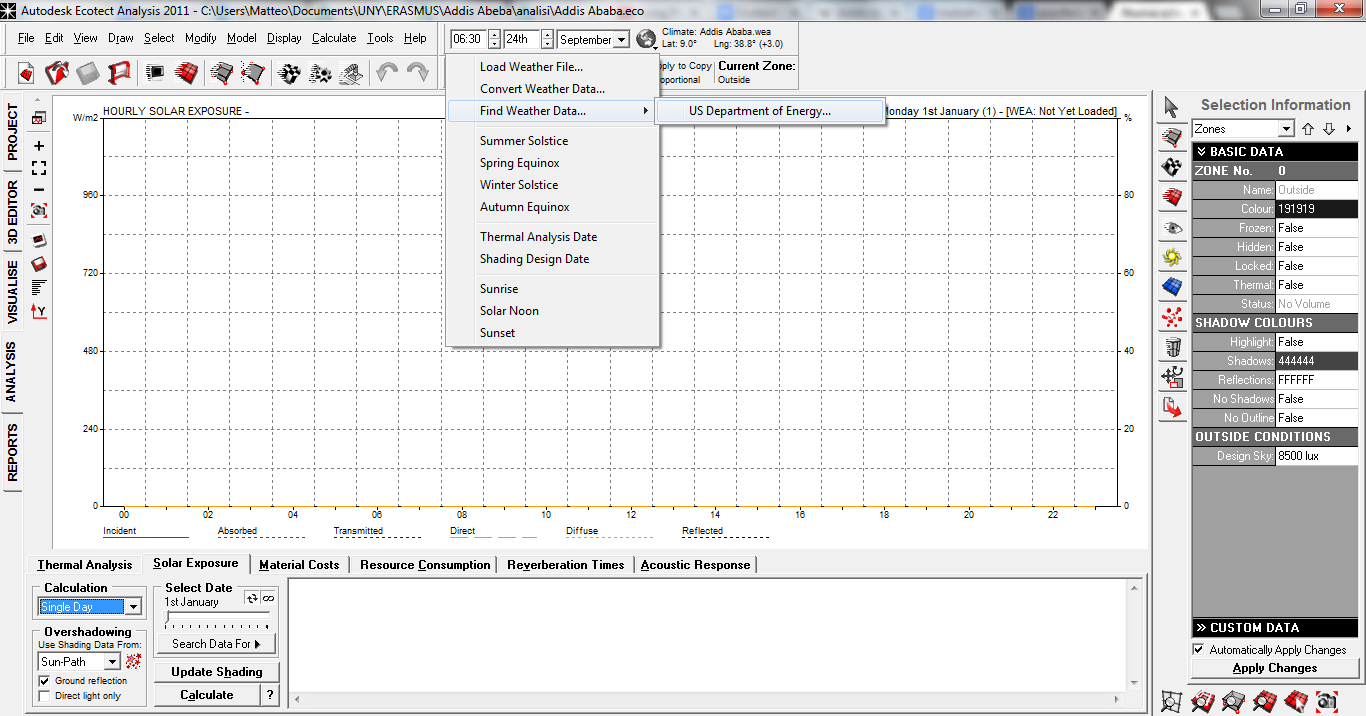
Per prima cosa è necessario caricare i weather data file (.wea): aperto Ecotect bisogna cliccare sul comando con disegnato sopra il mappamondo SET CURRENT LOCATION>FIND WEATHER DATA>US DEPARTMENT OF ENERGY e sul sito scegliere il luogo interessato.
Firstly you need to upload the weather data file (.wea): opened Ecotect you need to click on the command in which is drawn on the world map SET CURRENT LOCATION> FIND WEATHER DATA> US DEPARTMENT OF ENERGY and on the website choose the place concerned.
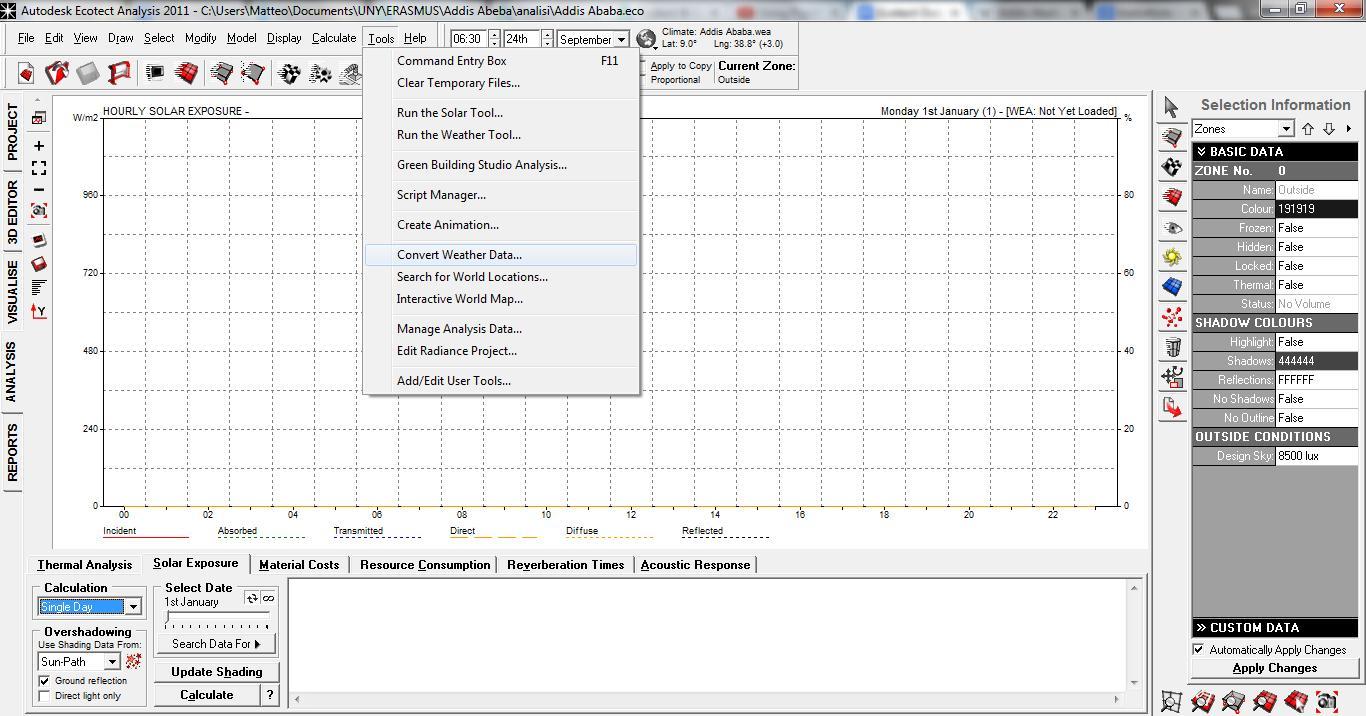
Per caricare il file .wea nel programma bisogna cliccare su TOOLS>CONVERT WEATHER DATA e dare ok. A questo punto il sito di progetto dovrebbe comparire in alto a destra come nell’immagine.
To upload a .wea file in the program you need to click on TOOLS> CONVERT WEATHER DATA and click ok. At this point the project site should appear in the upper right as in the image.
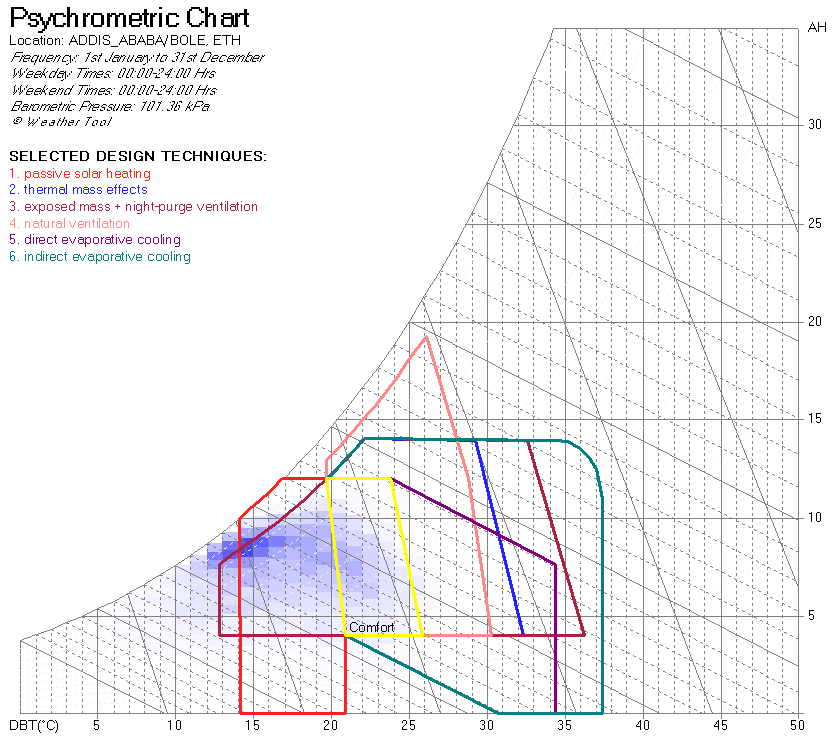
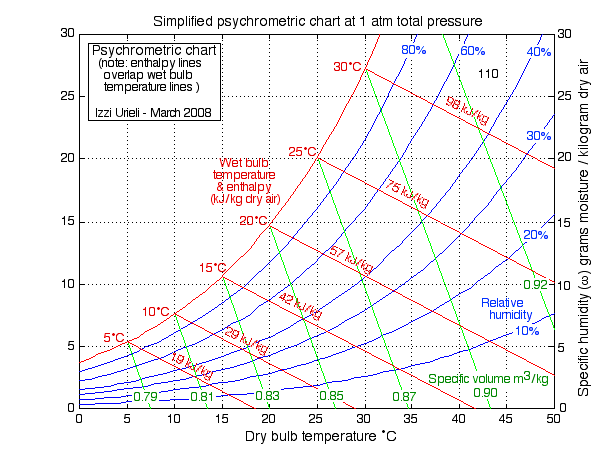
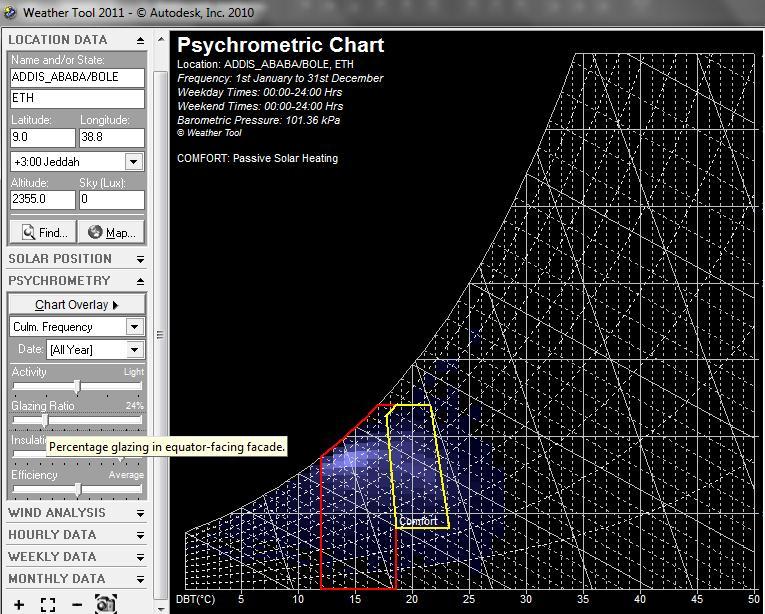
Prima di cominciare ad analizzare i dati è importante capire uno dei grafici fondamentali che ho usato per decidere quali strategie passive erano più efficaci: il diagramma psicrometrico.
Before starting to analyze the data it is important to understand one of the fundamental charts that I used to decide which passive strategies were more effective: the psychrometric chart.
All’interno del diagramma psicrometrico se i dati vengono rilevati in alcune zone ben definite si può giudicare la qualità di un determinato clima. Esso è disponibile in Ecotect in TOOL>RUN.
Inside the psychrometric chart if the data have been tooked over in certain demarcated areas you can judge the quality of a given climate. It is available in Ecotect using the command TOOL> RUN
THE WEATHER TOOL
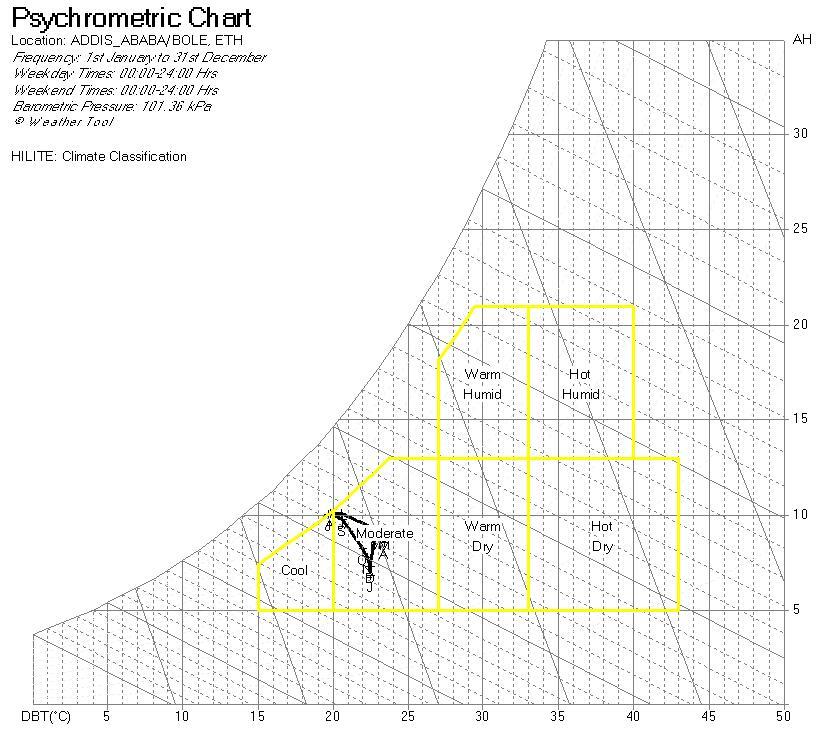
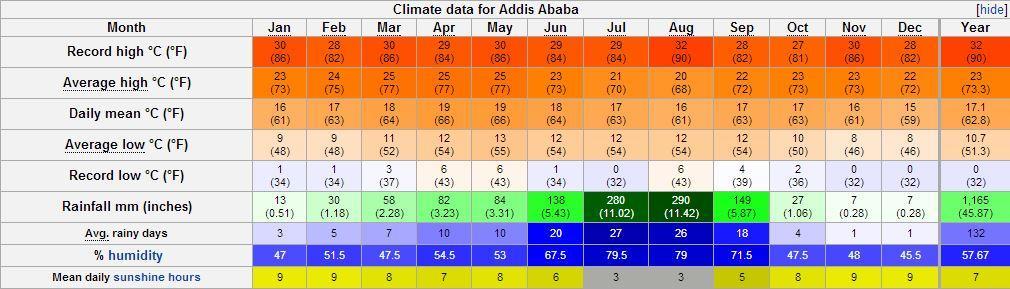
Come mostrato nell’immagine precedente è possibile notare che Addis Abeba (9.0°,38.8°, praticamente sulla linea dell’equatore) ha un clima moderato-fresco (essendo circa a 2500m di altezza).
Nel programma ecotect è possibile visualizzare la condizione di comfort per quel preciso clima. Importante è ricordarsi di impostare correttamente il programma d’uso del progetto: nel caso di abitazioni come queste è corretto impostarlo su LIGHT o SEDENTARY.
As shown in the picture above you can see that Addis Ababa (9.0 °, 38.8 °, practically on the equator) has a cool-temperate climate (being about 2500m high).
In the program Ecotect it’s possible to see the condition of comfort for that particular climate. It is important to remember to set up the usage program of the project properly: in the case of homes like these is correctly set to LIGHT or SEDENTARY.
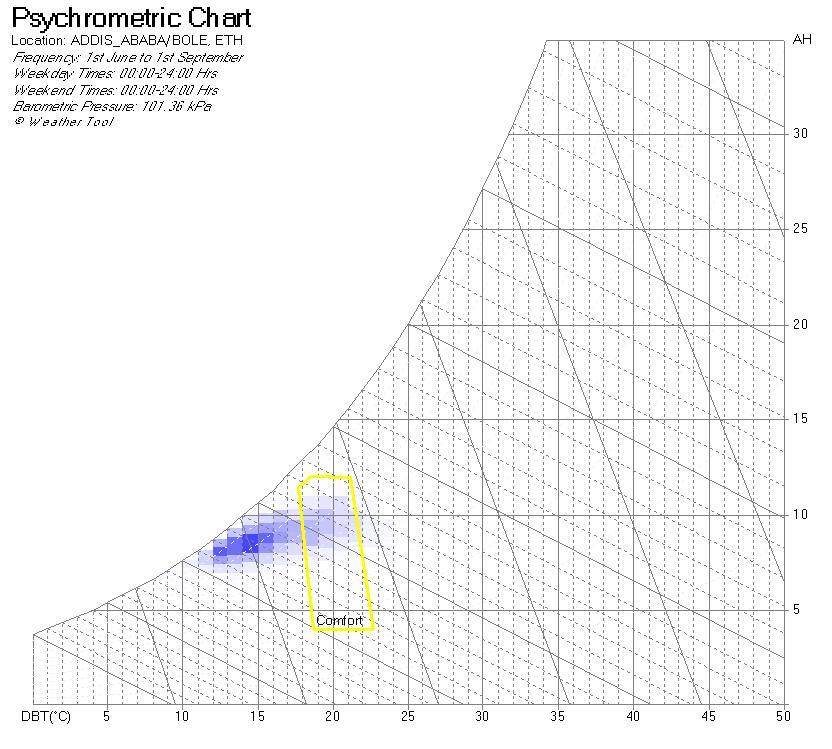
In questo modo si può vedere quanto i dati si discostano da quel comfort. Mostriamo di seguito i dati in estate..
In this way you can see how the data deviate from that comfort. We show below the data in the summer ..
… in inverno... (in the winter)
… e durante tutto l’anno
... and throughout the year.
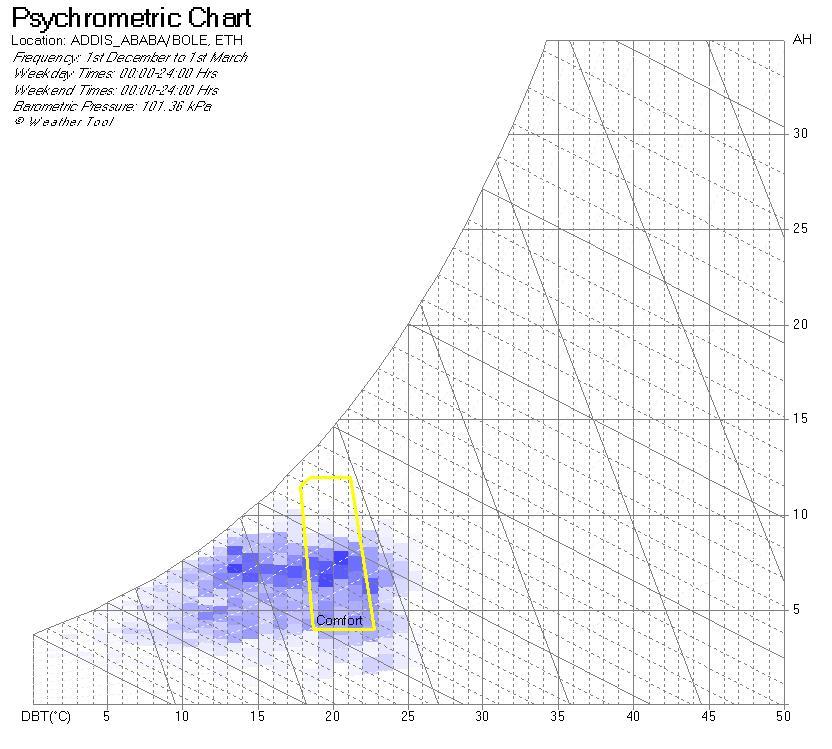
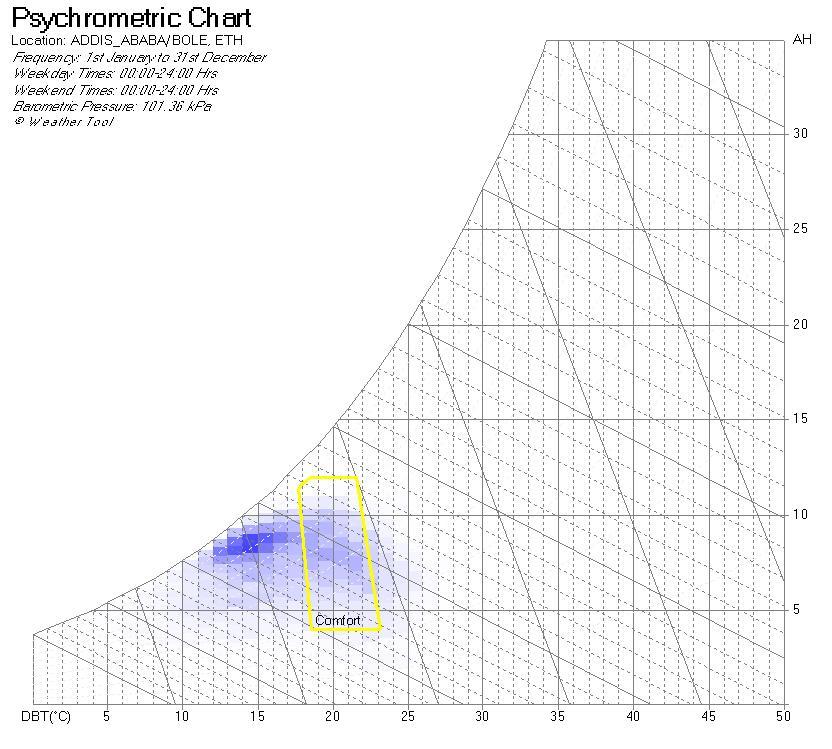
Come è visibile da questi grafici, il clima di Addis Abeba è costante durante tutto l’anno ed è piuttosto fresco. Questi dati sono riscontrabili anche da internet.
As you can see from these graphs, the climate of Addis Ababa is constant throughout the year and it is warm during the day and quite fresh during the night. This data can be found also from the Internet.
In the Ecotect Weather Tool on CHART OVERLAY you can see the passive strategies (shown in red). They allow you to "extend" the comfort zone and closest they are to the point cloud, more the energy strategy is effective. Here in particular I tried with the PASSIVE SOLAR HEATING, ensuring how having 24% of the glazing ratio of the wall (properly exposed) would be the best solution.
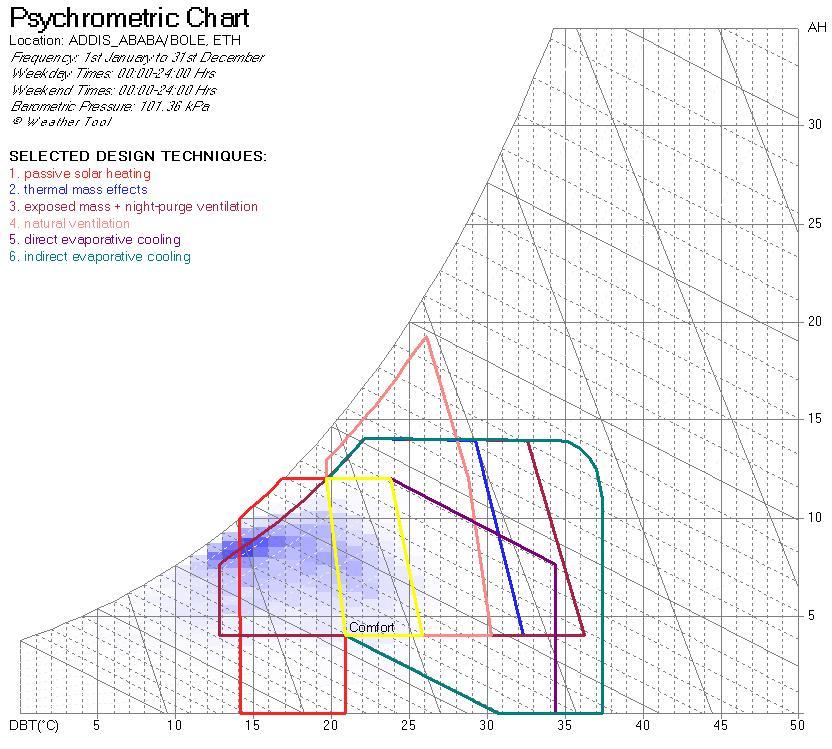
È possibile inoltre sovrapporre le diverse strategie passive per confrontarne l’efficacia cliccando su CHART OVERLAY>MULTIPLE TECHNIQUES.
You can also overlay the various passive strategies in order to compare the effectiveness clicking on the CHART OVERLAY> MULTIPLE TECHNIQUES
Ora siamo a conoscenza che le strategie passive adatte al clima di Addis Abeba sono sicuramente il PASSIVE SOLAR HEATING (assicurando il 24% della superficie vetrata esposta correttamente) e gli effetti della THERMAL MASS.
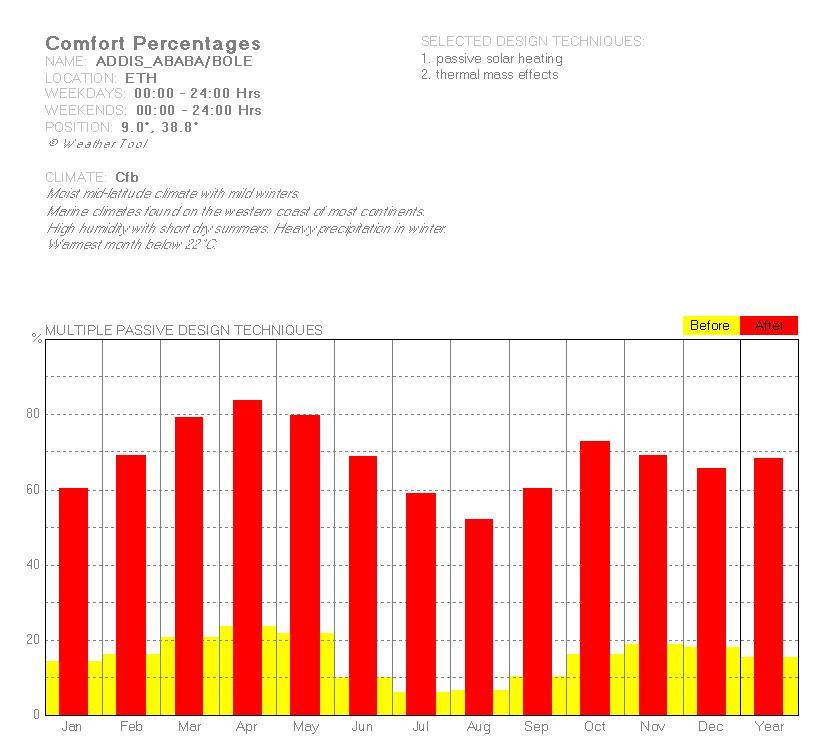
Per verificare il miglioramento del comportamento energetico del nostro edificio tramite queste due strategie passive possiamo selezionarle CHART OVERLAY>PASSIVE DESIGN ANALYSIS e spuntare solo PASSIVE SOLAR HEATING e THERMAL MASS. Il risultato sarà il seguente grafico.
Now we know that the best passive strategies for the climate of Addis Ababa are definitely the PASSIVE SOLAR HEATING (providing 24% of the glass surface exposed correctly) and the effects of THERMAL MASS.
To verify the improvement of the energy efficiency of our building through these two passive strategies we can select CHART OVERLAY> PASSIVE DESIGN ANALYSIS and check only PASSIVE SOLAR HEATING and THERMAL MASS. The result will be the following graph.
Segna un miglioramento con una media del 65% circa, utilizzando solo strategie passive, quindi senza consumo di energia!
There is an improvement by an average of about 65%, using only passive strategies, thus without energy consumption
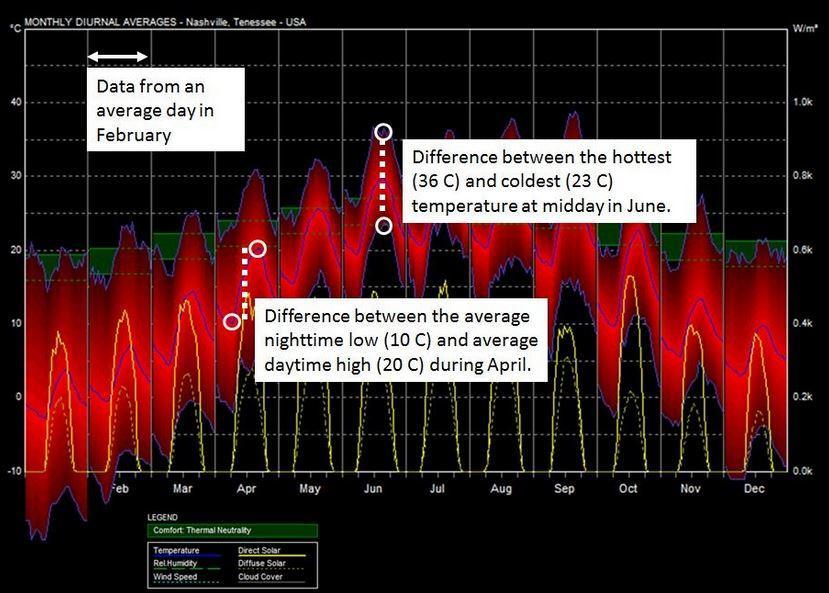
Per confrontare ancora questi risultati e cominciare a fare un altro tipo di considerazioni, Ecotect mette a disposizione altri grafici, come il MONTHLY DIURNAL AVERAGES, che va letto in questo modo..
To compare these results and start to make another kind of considerations, Ecotect provides other graphics, such as the MONTHLY DIURNAL AVERAGES , which should be read in this way ..
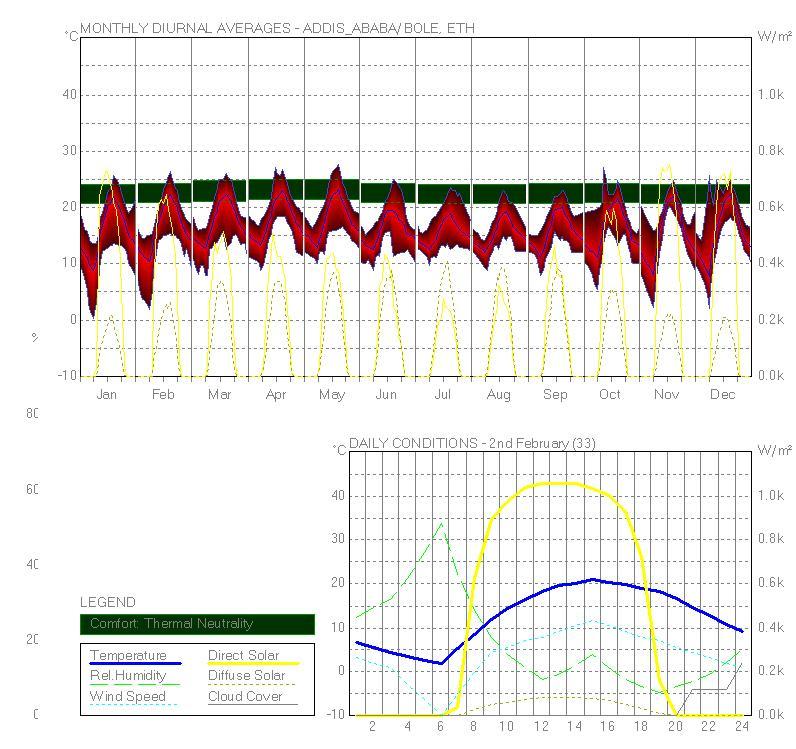
Nel caso di Addis Abeba si presenta così nel giorno più caldo...
In the case of Addis Ababa it looks like this in the hottest day ...
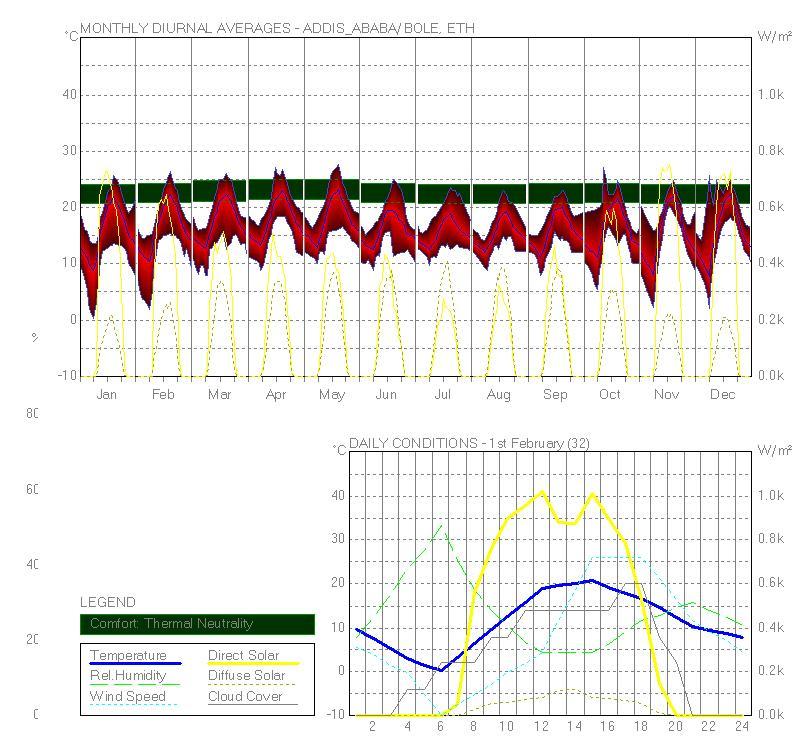
nel giorno più freddo… (…in the coldest day….)
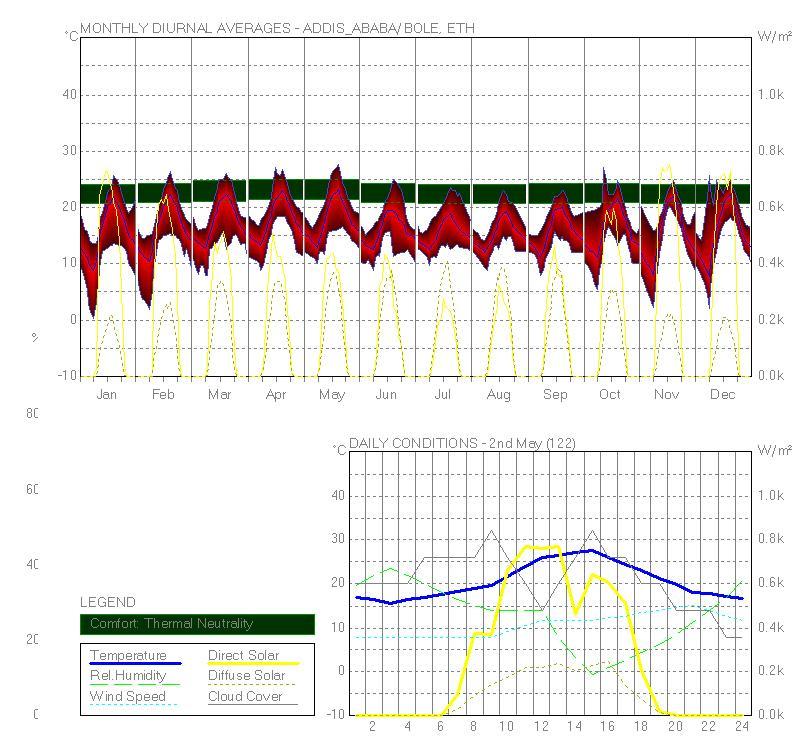
e nel giorno più luminoso. (…and in the brightest day)
Dal grafico superiore (sempre uguale in tutte le immagini) è possibile notare come ad Addis Abeba i mesi in cui si riceve più luce diretta del sole sono Ottobre, Novembre, Dicembre, Gennaio e Febbraio, mentre le temperature alte sono costanti durante tutto l’anno e le temperature raggiungono i picchi più bassi a Novembre, Dicembre, Gennaio e Febbraio. Andando ad incastrare questi dati è evidente come il PASSIVE SOLAR HEATING sia più efficace a Novembre, Dicembre, Gennaio e Febbraio.
La campitura solid verde mostra invece come le temperature siano mediamente al di sotto della THERMAL NEUTRALITY praticamente sempre, rafforzando le considerazioni fatte inizialmente sul regime fresco del clima in questione.
From the upper graph (always the same in all the photos) you can see that in Addis Ababa, the months in which you receive more direct sunlight are October, November, December, January and February, while high temperatures are constant throughout the year and the temperatures reach the lower peaks in November, December, January and February. Comparing these data it is evident that the PASSIVE SOLAR HEATING is more effective in November, December, January and February.
The solid green pattern shows instead as the temperatures are on average almost always below the THERMAL NEUTRALITY, reinforcing the considerations made initially on the fresh climate regime in question.
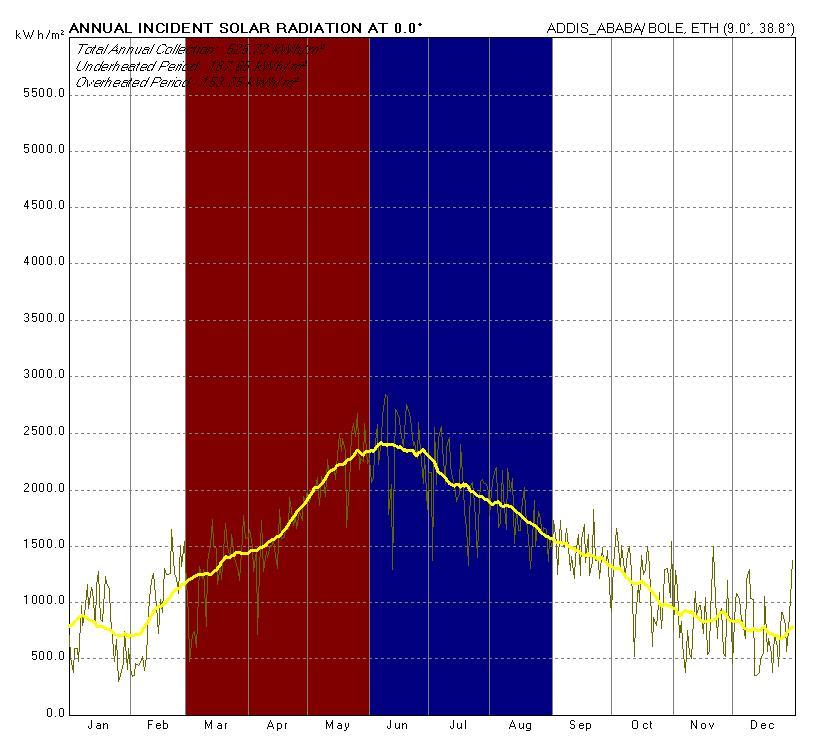
Andando sul menu a tendina SOLAR POSITION>DISPLAY TYPE>ANNUAL SOLAR RADIATION possiamo controllare quanti kWh/mq abbiamo effettivamente a disposizione in ogni mese da poter sfruttare per le nostre strategie passive.
Going on the drop-down menu SOLAR POSITION> DISPLAY TYPE> ANNUAL SOLAR RADIATION we can check how many kWh/m² we have actually available in any month that we can use for our passive strategies.
Then clicking the tool BEST ORIENTATION, still in the drop-down menu SOLAR POSITION it is possible to know the best orientation that the main facade of our building should have.
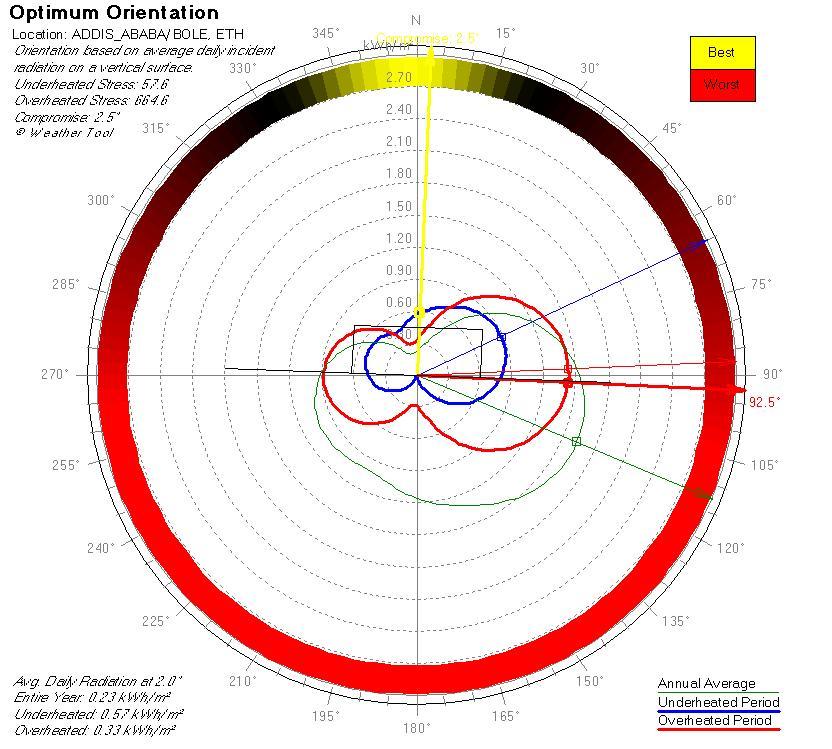
La freccia gialla indica l’orientamento ottimale, esso viene calcolato in base all’underheated period e all’overheated period.
The yellow arrow indicates the optimum orientation, it is calculated according to the underheated period and the overheated period.
Per vedere se esiste la possibilità di sfruttare la ventilazione naturale ho aperto il menu a tendina WIND ANALYSIS, poi ho selezionato come periodo di analisi SUMMER e ho cliccato in basso nello stesso menu SHOW COMPARISON.
To see if it is possible to take advantage from the natural ventilation I opened the drop-down menu WIND ANALYSIS, then I selected period of analysis SUMMER and I clicked at the bottom of the same menu SHOW COMPARISON.
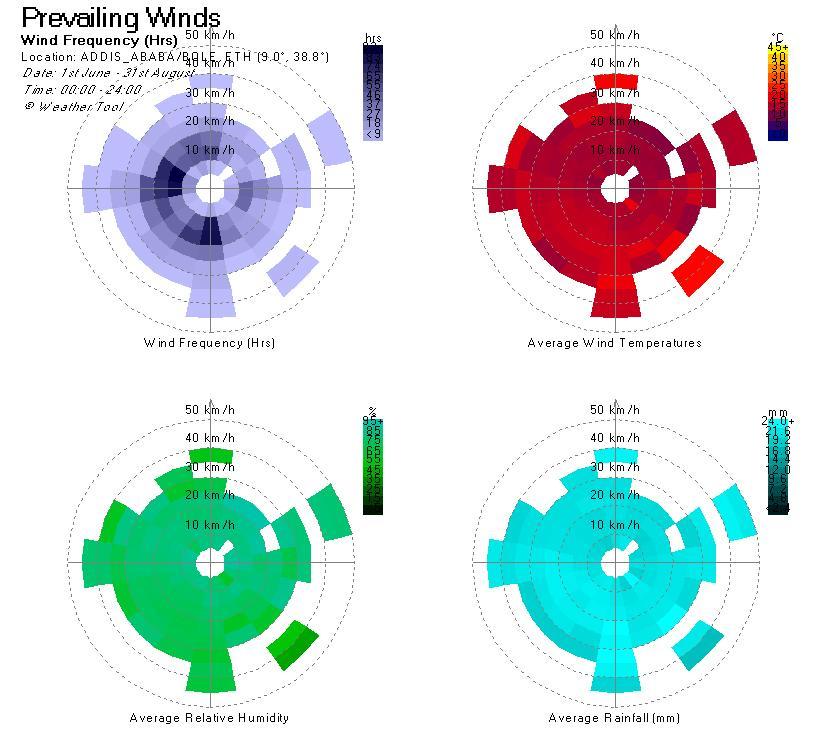
Qui è possibile vedere da che direzione arriveranno i venti, a che temperatura e con che frequenza. È consigliabile partire considerando prima la frequenza, quindi l’affidabilità della strategia passiva durante il periodo selezionato.
In questo grafico si evince che i principali venti proverranno da SUD e da OVEST con una temperatura di 25°C in estate.
Here you can see from which direction the winds will come, at which temperature and how often. It is advisable to start considering the frequency first (the reliability of the passive strategy during the selected period).
In this graph it is clear that the main winds come from the south and west with a temperature of 25 ° C in summer.
Il seguente grafico invece mostra la situazione invernale
The graph below shows instead the winter situation.
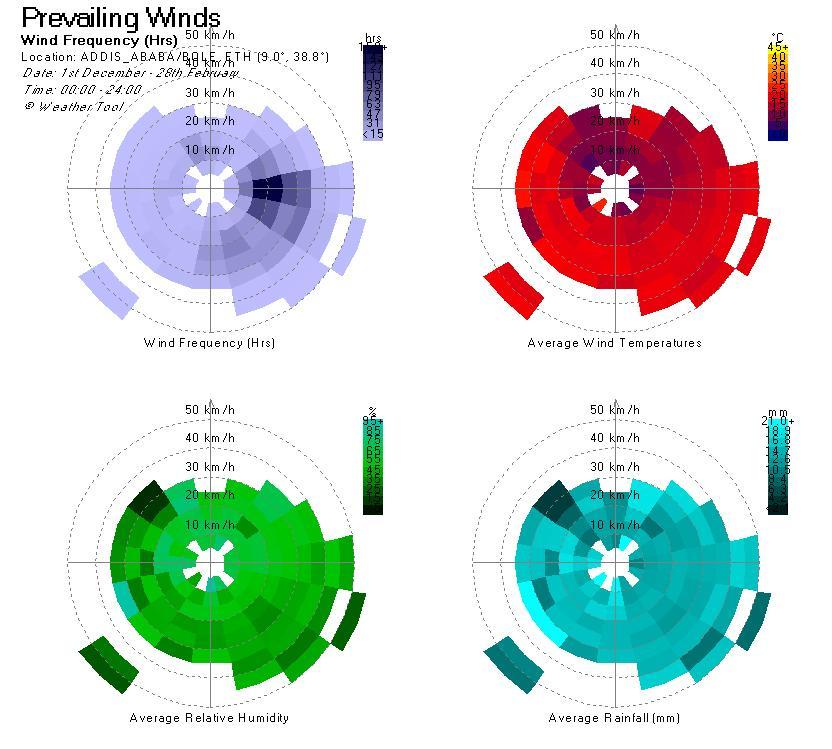
In inverno c’è una prevalenza di venti da EST con una temperatura di 10°C
In winter there is a prevalence of winds from the EST with a temperature of 10 ° C
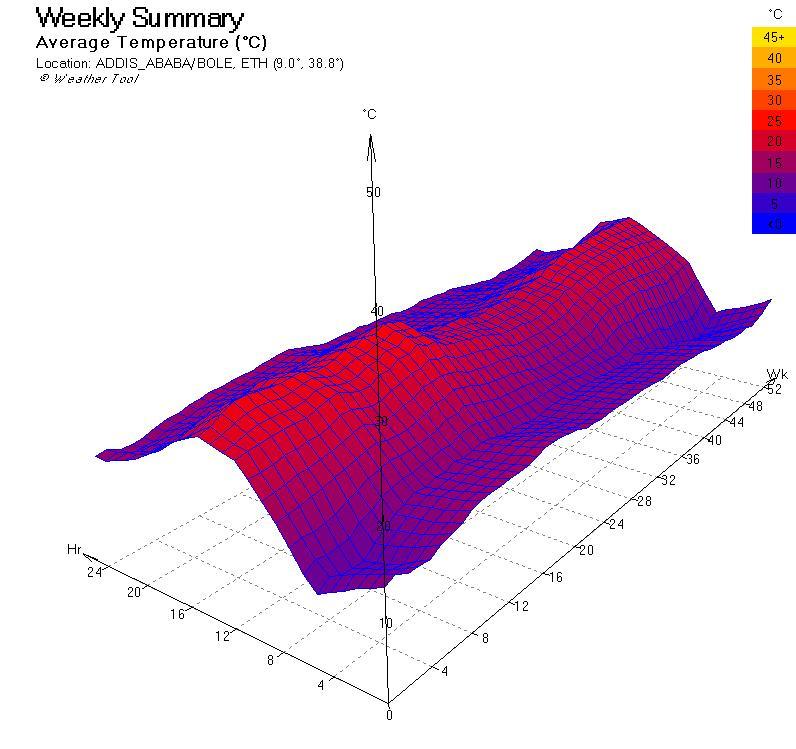
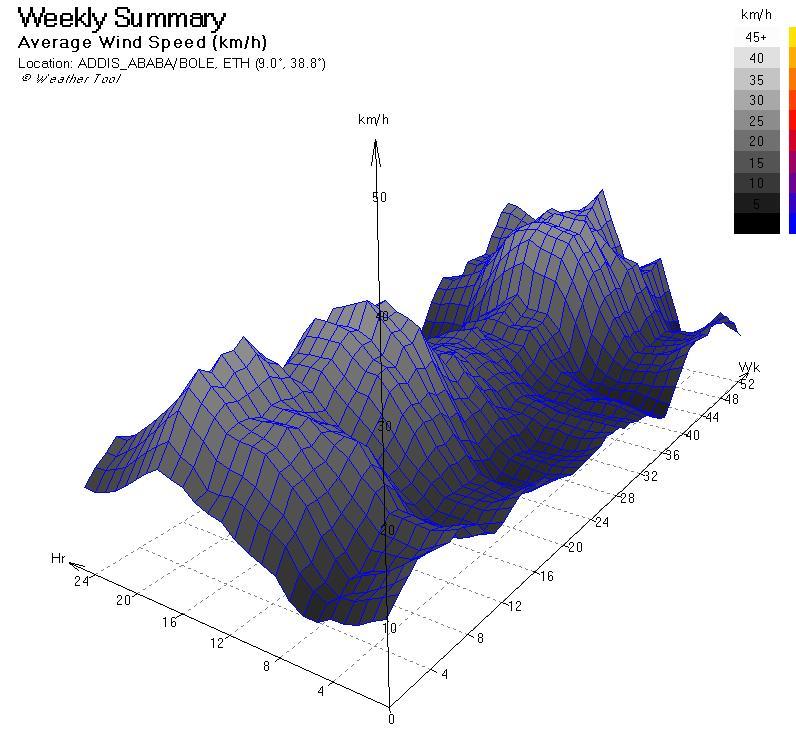
Per avere una graficizzazione più completa è possibile selezionare il menu a tendina WEEKLY DATA, dove la visualizzazione 3D ci permette una più immediata comprensione quantitativa dei dati. Di seguito viene riportato il grafico della AVERAGE TEMPERATURE
To get a more complete charting you can select the drop-down menu WEEKLY DATA, where 3D visualization allows us a greater quantitative understanding of the data. Below is the graph of the AVERAGE TEMPERATURE.
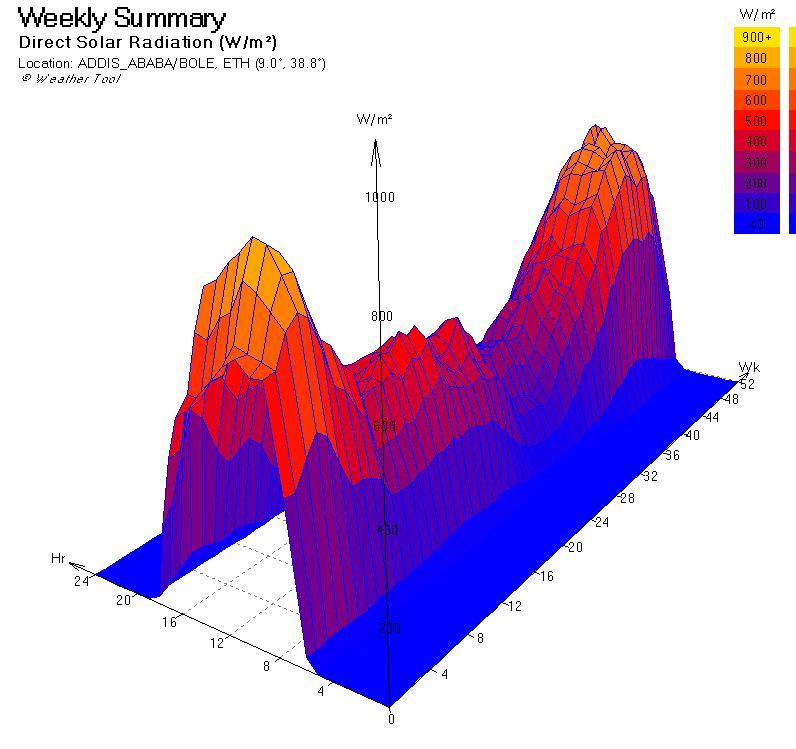
Poi della DIRECT SOLAR RADIATION
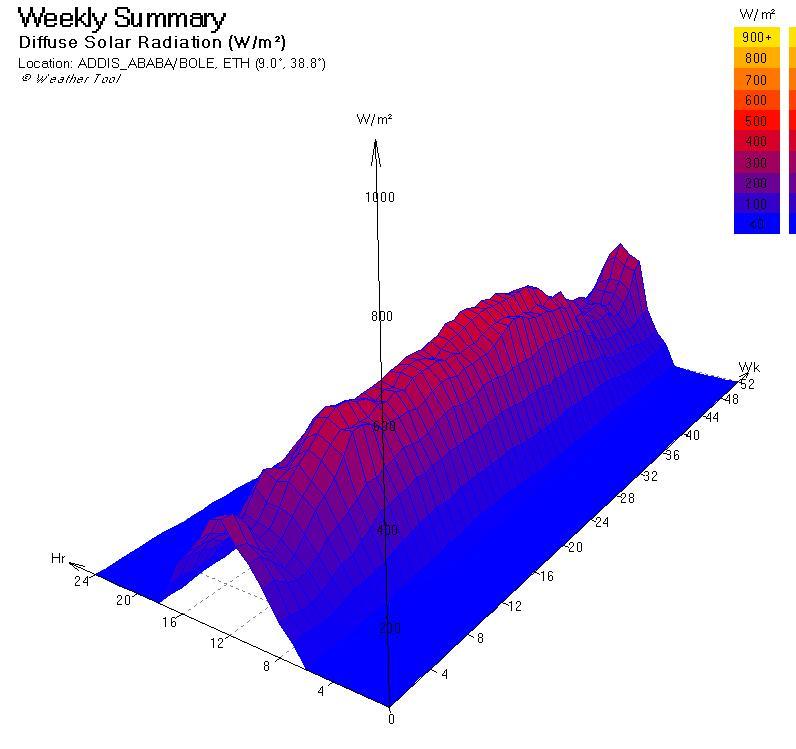
Della DIFFUSE SOLAR RADIATION
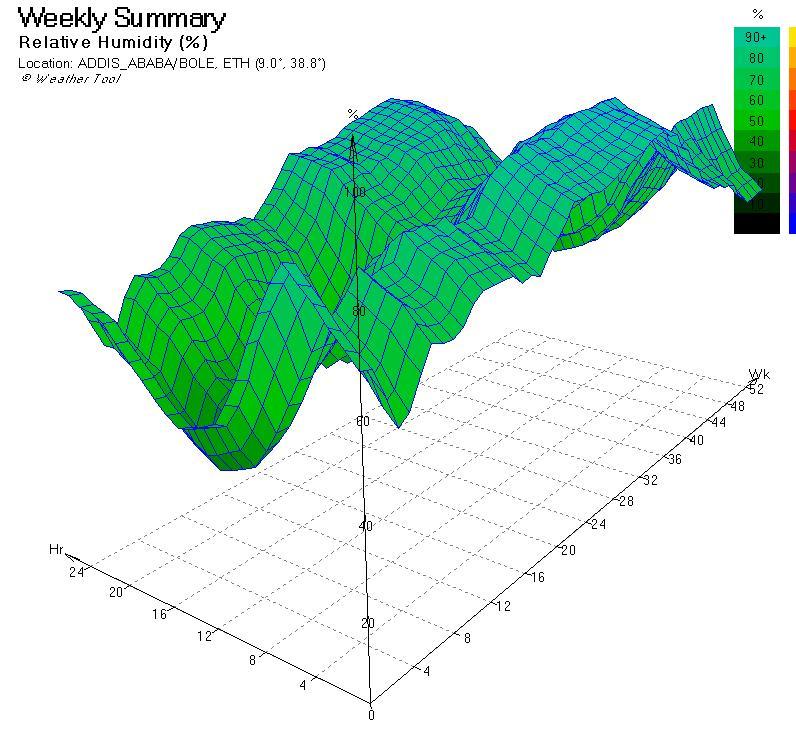
Della RELATIVE HUMIDITY %
Del CLOUD COVER %
E del WIND SPEED AVERAGE

Anche qui cliccando su SHOW ALL è possibile vederli tutti assieme per fare delle considerazioni complessive.
Even here clicking on SHOW ALL you can see them all together to make overall considerations.

Come possiamo notare questi grafici confermano un’altra volta le considerazioni che abbiamo fatto la volta scorsa: ad Addis Abeba la temperatura media è costante durante tutto l’anno ma c’è una grande escursione termica durante l’arco della giornata, che va ad aggravarsi durante il periodo estivo diminuendo il comfort (per questo nel diagramma psicrometrico la situazione estiva presentava più punti lontani dal comfort di quella invernale). La radiazione solare incidente è maggiore da Dicembre a Marzo (proprio quando è più utile nella strategie passiva del solar heating).
As we can see these graphs confirm again the considerations that we did last time: at Addis Ababa, the average temperature is constant throughout the year but there is a large temperature range during the day, going to be worsen during the summer reducing the comfort (that’s why in the psychrometric chart, the situation on summer appeared more points away from the comfort of the winter). The incident solar radiation is increased from December to March (when it is most useful in passive solar heating strategies).
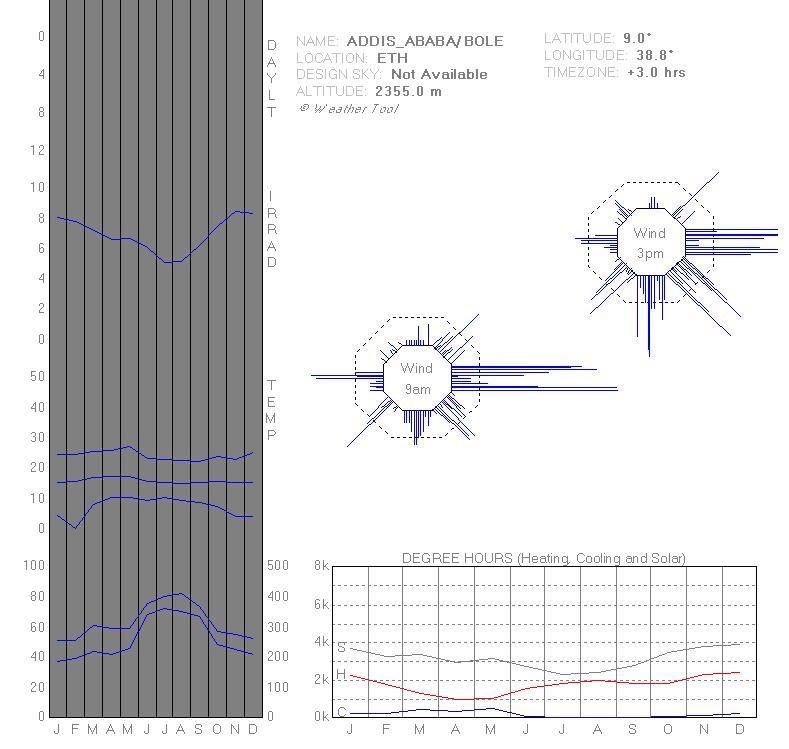
Infine sul menu a tendina MONTHLY DATA abbiamo una sorta di riassunto di quanto detto finora.
Finally in the drop-down menu MONTHLY DATA we have a kind of summary of what has been said so far.
Tramite queste analisi condotte con Ecotect abbiamo desunto quali strategie passive utilizzare nel nostro edificio ancor prima di cominciare a progettarlo. Si tratta di una buona base di partenza per fare scelte funzionali e mirate alla sostenibilità ed al risparmio energetico. Tutto questo solo analizzando il weather file tramite il software!
Andando a riassumere, abbiamo scoperto:
- le strategie passive che il nostro edificio deve avere sono massa termica e solar heating. Avvalendosi di queste sole due strategie il nostro edificio consumerà il 65% in meno di energia;
- il solar heating è garantito dal 24% di superficie vetrata (orientata correttamente);
- l’orientamento migliore per la facciata principale è di 2,5°N;
- per sfruttare al meglio la ventilazione naturale in estate dobbiamo avere delle aperture ad ovest e a sud;
- per sfruttare al meglio la ventilazione naturale in inverno dobbiamo avere delle aperture ad est.
Through these analyzes with Ecotect we have decided which passive strategies will be used in our building even before start designing it. This is a good starting point for making functional choices focused on sustainability and energy saving. All this just by analyzing the weather file using the software!
Going to sum up, we found:
- The passive strategies that our building should have are thermal mass and solar heating. Making use of only these two strategies our building will consume 65% energy less;
- The solar heating is provided by 24% of the glazing ratio (oriented correctly);
- The better orientation for the main facade is 2.5° N;
- To take advantage of natural ventilation in summer we must have the openings to the west and south;
- To take advantage of natural ventilation in winter we must have the openings to the east.