Analisi energetiche comparate: una tesi di laurea
“ll tema energetico ci dà una grande opportunità linguistica, di disegnare gli edifici in maniera diversa: il risultato non sarà un’architettura complicata ma un’architettura nuova”. M.Cucinella
“Energy issue give us a great linguistic opportunity, to design building in a different way: the result won’t be a complicated architecture but a new architecture”. M.Cucinella
L’obiettivo di questa prima parte del lavoro è quello di approcciare con uno strumento come Autodesk Vasari che permette, a partire da una modellazione concettuale effettuata all’interno del programma stesso (oppure creata precedentemente in Revit e qui importata) di eseguire analisi energetiche in fase di progettazione. A partire dalla modellazione di una semplice massa concettuale, vedremo come alcune variazioni di parametri o di geometrie andranno ad influenzare i risultati delle analisi.
The goal of this work is to approach with a useful tool such as Autodesk Vasari that allows, starting from a conceptual modeling within the program itself (or previously created in Revit and imported here) to perform energy analysis since the first design phase. Starting with conceptual modeling of a simple mass, we will see how some variations of parameters like building shape ,orientation or mass shading will influence analysis results.
Prima di iniziare con la modellazione dal menù principale-> Options ->File Location, cambio il template di default da US Imperial a US Metric.
Iniziamo con New-> Project
Before you start with modeling from the main menu-> Options ->File Location, change the default template from U.S. Imperial to U.S. Metric.
Let’s start with New-> Project
img 01
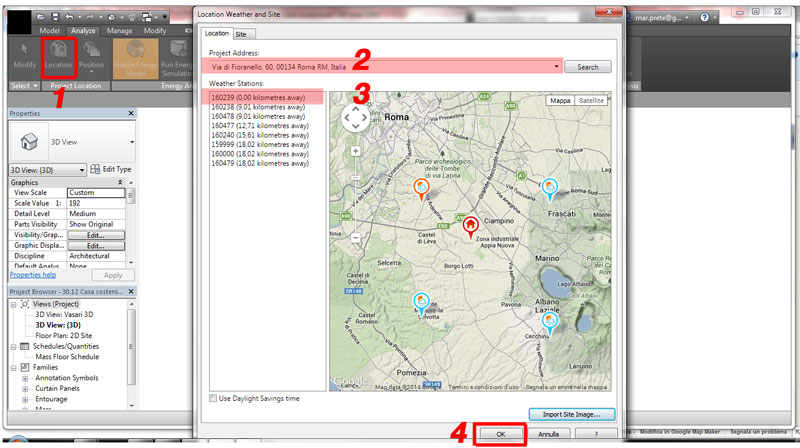
Analyze –> Location – specifico le indicazioni geografiche del sito di progetto e seleziono la stazione meteo di acquisizione dati per le analisi energetiche. Possiamo anche importare l’immagine del sito progetto.
From Analyze tab-> Location - specific geographical indications of building location an select the data tak-over weather station for energy analysis. You can also import the image of building location within the environment project.
img 02
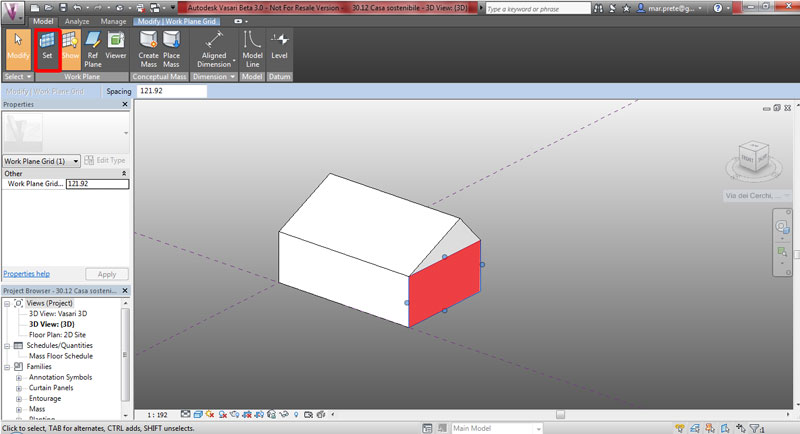
È molto importante fare attenzione ai piani di riferimento o Workplane durante la modellazione. Rinomino i piani di default con la quota corrispondente: +0.00, +3.00 ecc.. modificandone la posizione nel modello. Set Work Plane -> Seleziono il piano di lavoro.
It’s important to pay attention to the reference planes or Workplane during modeling. Rename the default planes with the corresponding height: +0.00, +3.00 etc. .. changing its position in the model. Click Set Work Plane.
img 03
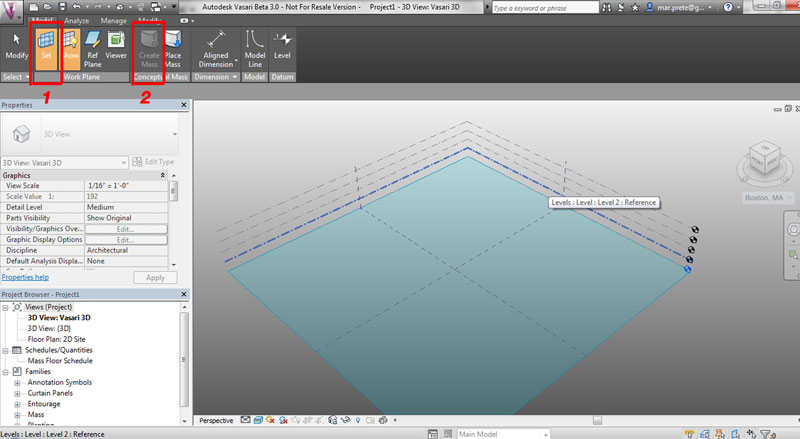
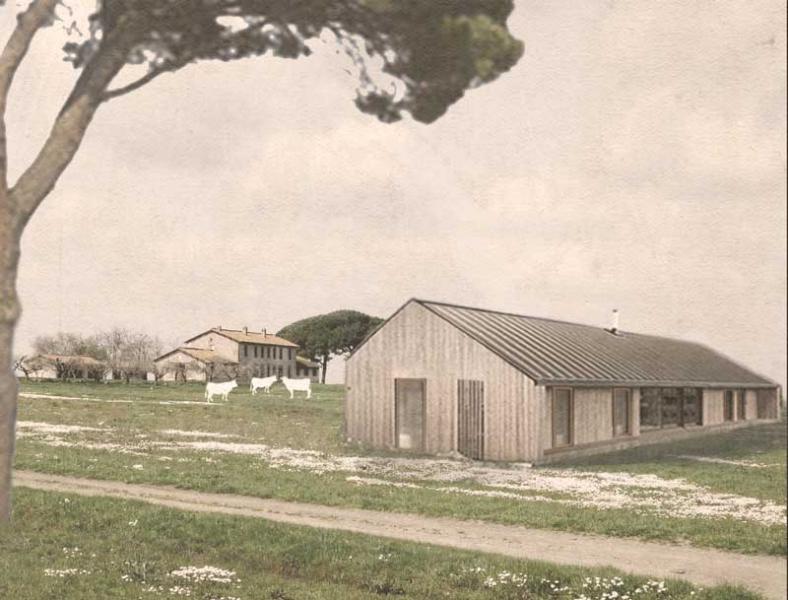
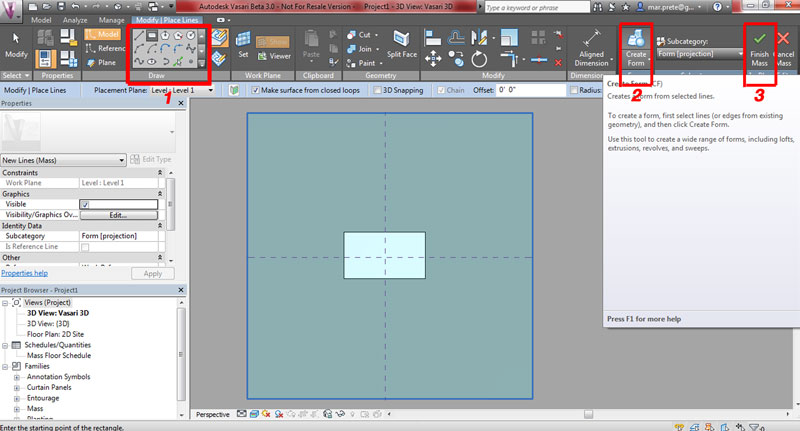
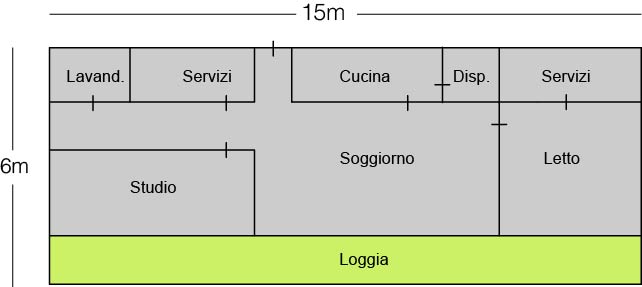
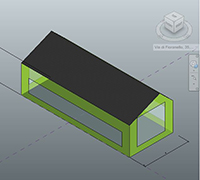
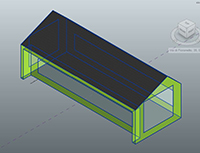
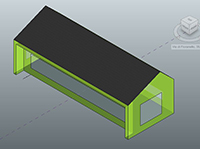
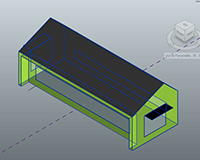
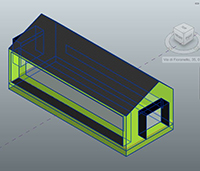
L’esercizio consiste nel ragionare sulla modellazione di un’abitazione a Roma. Inizio col creare due semplici masse, un richiamo alla morfologia dei tradizionali casali e fienili della campagna romana, il luogo di progetto scelto precedentemente. Clicco su Create Mass e creo unitamente le due masse servendomi degli strumenti di disegno all’interno del pannello Draw: la prima con piano di riferimento coincidente col terreno e la seconda, per la doppia falda, a partire dall’estrusione di un triangolo disegnato sul corretto piano di riferimento, il tutto senza uscire dal comando; unisco poi le due masse con Modify-> Join Geometry. Infine -> Finish Mass. Ricordiamoci che stiamo effettuando una modellazione concettuale per cui le parti costruttive dell’edificio sono definite da piani.
The exercise focuses on the conceptual modeling of a roman home. Start creating two simple masses, a reference to the morphology of traditional farmhouses and barns of the Roman countryside, project site choosen beforehand. Click on Create Mass and create two masses through the drawing tools in the Draw panel: the first one with the reference plane coincident with the ground and the second one for the roof, starting with the extrusion of a triangle drawn on the correct reference plane, all without going out from the command; then join the two masses with Modify-> Join Geometry. Finally -> Finish Mass. Let us remember that we are making a conceptual modeling so the structural parts of the building are defined by planes.
img 04-05
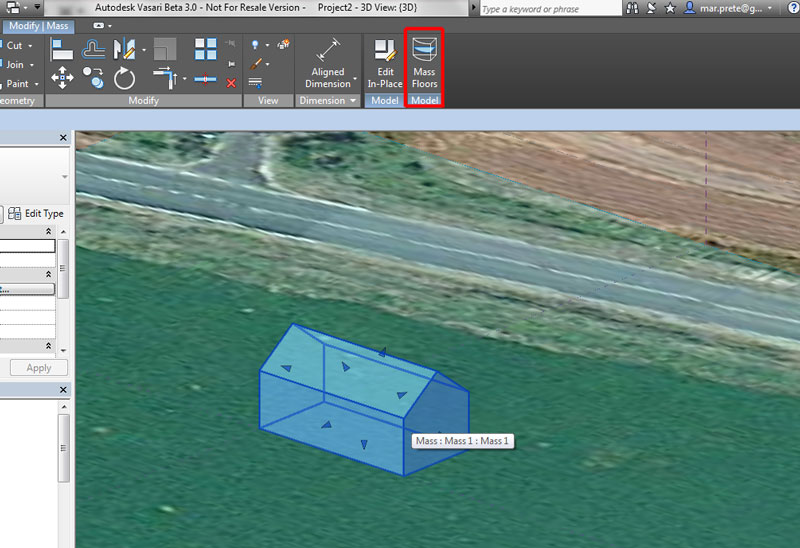
Scelgo ragionevolmente di orientare l’edificio con l’asse corto lungo l’allineamneto Nord-Sud. A questo punto, seleziono la massa e clicco all’interno del pannello Model-> Mass Floor , mediante il quale creeremo una massa di piano per ogni livello definito. Selezioniamo solo il livello +0,00 ipotizzando che l’abitazione sia sviluppata su un solo livello.
Reasonably I choose to orient the building with a North-South short axis. In the project environment, select the mass model, and in the Model tab-> Mass floor, to adding mass floors for every selected level. Select only level +0,00 assuming that the house is built on one level.
img 06
Selezionando la massa con Edit in Place posso sempre tornare a modificare la massa di partenza: ad esempio, voglio abbassare la linea di colmo della copertura, per cui seleziono lo spigolo e vado a modificarlo nella vista laterale.
Selecting the mass with Edit in Place you can ever go back to change the initial mass: for example,if you want a lower roof’s ridge line, select the edge and go in the side view to modify it.
img 07

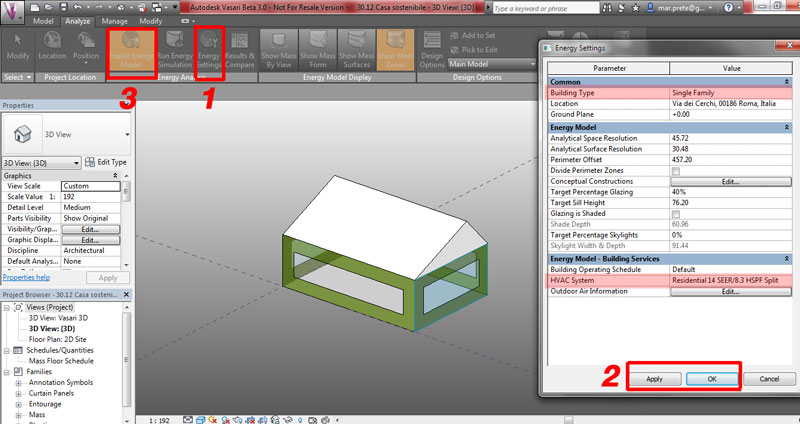
Cominciamo a questo punto a definire il modello energetico del nostro edificio: assegnamo alcuni parametri da Analyse-> Energy Settings.
Per ora lasciamo le impostazioni di default, cambiando:
Byilding Type: Single Family (l’utenza dell’edificio)
HVAC System: Residential 14 SEER/8.3 HSPF (il tipo di impianto presente per il condizionamento , in questo caso un impianto a split e pompa di calore)
Apply->Ok. Attivo la visualizzazione del modello energetico Analyse->Enable Energy Model e all’interno del pannello Energy Model Display seleziono Show Mass Zone : vengono così evidenziate con diversi colori masse diverse dell’edificio, nonché superfici vetrate o schermature, se specificate.
Let’s start to define the energy model of our building: assign some parameters Analyse-> Energy Settings.
For the moment, leave the default settings, changing:
Byilding Type: Single Family (the users of the building)
HVAC System: Residential 14 SEER/8.3 HSPF (the type of air conditioning system present, in this a split and heat pump)
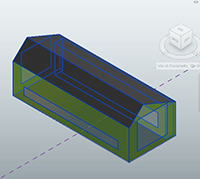
Apply-> Ok. Active the visualization of the energy model Analyse-> Enable Energy Model and in the Energy Model Display panel select Show Mass Zones: different masses are shown with different colors, as well as glass surfaces or shields, if specified.
img 08
Vediamo che nel modello compaiono delle superfici vetrate, ad una precisa altezza da terra, sulle chiusure perimetrali, questo perché abbiamo lasciato dei parametri di default nelle Energy Settings:
Target Percentage Glaze: 40 %
Target Sill Height: 76.20
Questi parametri possono essere editabili in modo specifico, facciata per facciata, dalla fnestra delle proprietà.
We see that in the model the glass surfaces appear at a precise height above the ground, on the side walls, this is because we left the default parameters in the Energy Settings:
Glaze Target Percentage: 40%
Target Sill Height: 76.20
These parameters can be edited in a specific way, face to face, from the properties dialog box.
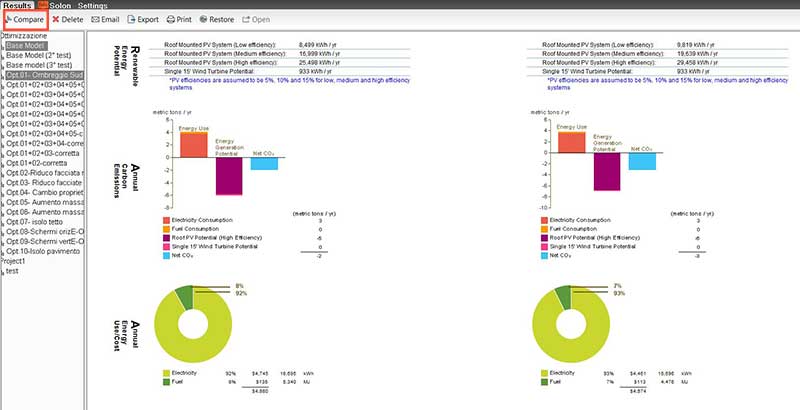
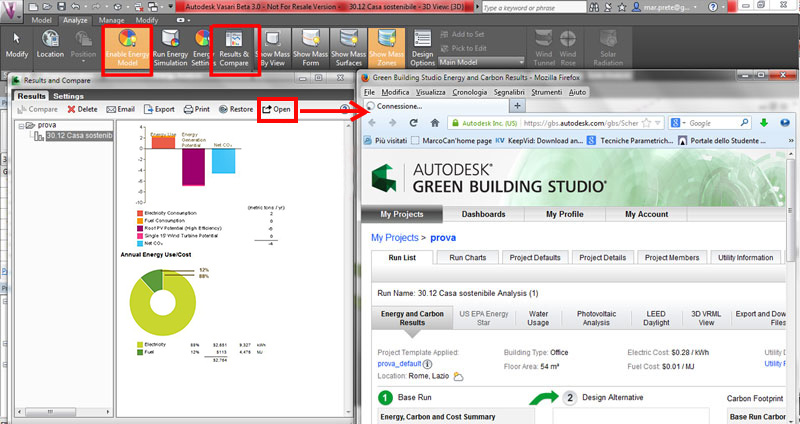
Proviamo a mandare una prima analisi. Clicchiamo su Run Energy Simulation, le informazioni riguardanti il modello energetico vengono inviate a un servizio web, Green Building Studio che elabora i dati e genera un’analisi. è possibile visionare i risultati delle analisi direttamente in Result and Compare, oppure accedendo al servizio web. è possibile inoltre comparare due o più analisi relative allo stesso edificio o a edifici diversi selezionandoli entrambi mediante il comando Ctrl da tastiera e poi cliccando su Compare. I risultati delle analisi appariranno parallelamente all’interno della finestra di modo che sarà facilitata la comparazione tra le due.
Try to run a first analysis. Click on Run Energy Simulation,the informations about the energy model are sent to a web service, Green Building Studio, which processes the data and generates an analysis. You an access analysis results from the Results and Compare dialog box. You can also compare two or more energy analysis of the same building or different ones by selecting both the Results with Ctrl command on the keyboard and then click on Compare. The results of the analysis appear in parallel inside the window so that it will be easier comparison between the two.
img 09-10

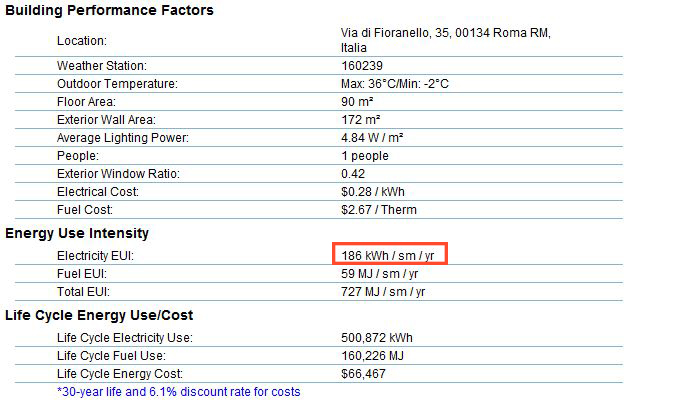
Essendo l’obiettivo di questa prima fase fare in modo che l’abitazione consumi il meno possibile, il dato che dobbiamo verificare è riferito all’ EUI, Energy Use Intensity, ossia quanta energia, sottoforma di elettricità e combustibili fossili, l’edificio consuma in un anno sull’area unitaria di piano (kWh/mq/annuo). Si tratta di un valore riferito al mq e indipendente dalla dimensione dell’edificio, utile proprio per paragonare edifici di dimensioni diverse.
Proviamo ora a migliorare la performance del nostro edificio mediante conoscenze di base e strumenti molto utili quali la PES chart e i grafici relativi ai carichi termici estivi e invernali.
Since the objective of this first phase is to make sure that the home consumption as little as possible, the data that we have to check is referred to EUI, Energy Use Intensity, how much energy, in the form of electricity and fossil fuels, the building consumes yearly in the unit area (kWh / sqm / year). It is a value related to the unit area and independent of the size of the building,so it’s useful to compare buildings of different sizes. We try to improve the performance of our building through basic knowledges and very useful tools like the PES Charts and charts related to the monthly heating and cooling loads.
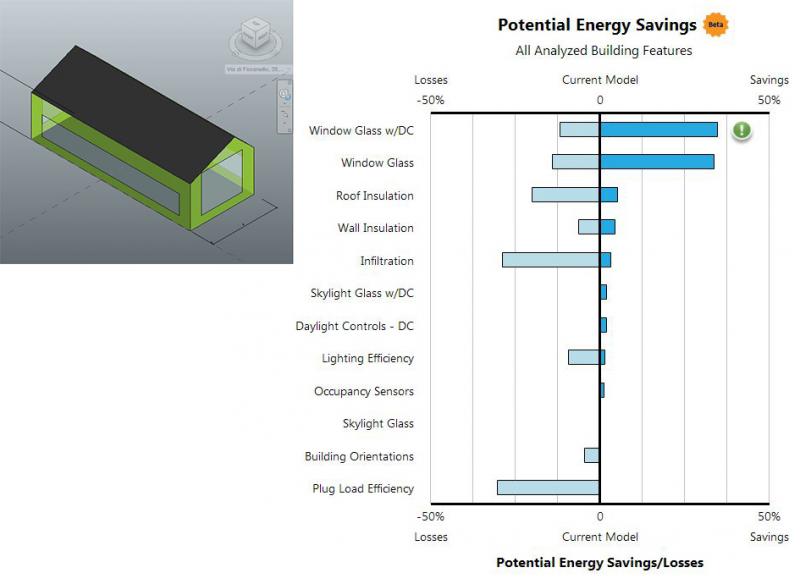
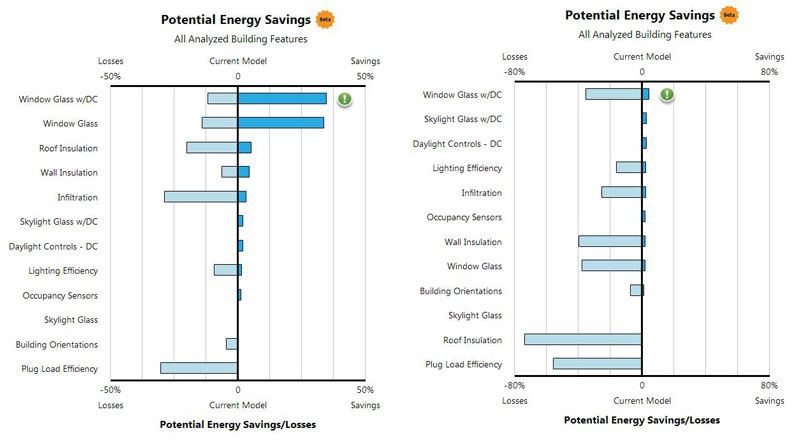
PES CHART: Questo è un potente strumento che ci dice dove è possibile apportare miglioramenti all’ edificio e come ottimizzarne l’uso di energia. La linea verticale centrale a 0 rappresenta la prestazione energetica del modello, come presentato per l’analisi. Le barre che si estendono più a destra della linea di base hanno maggiore potenziale di risparmio energetico, sono quindi dei margini di migliorabilità. Le barre che si estendono più a sinistra hanno una maggiore possibilità di perdite di energia, che si avrebbe regredendo sulla scelta progettuale relativa a quella caratteristica. Da questa emerge che le caratteristiche costruttive più sensibili nell’uso di energia sono i carichi termici legati a superfici vetrate, elettrodomestici e computer, isolamento del tetto,infiltrazione.
Altri parametri che sono importanti sono l’ orientamento, l’efficienza dell’ illuminazione, e l’ isolamento termico delle pareti.
•Il margine più elevato di miglioramento energia consiste nel cambiare il vetro della finestra. (~ miglioramento del 35%). Il modello di edificio attuale ha un vetrocamera con vetri chiari con un valore U di 3.17, un SGHC di 0,69 e 0,78 di Tvis.
•L’isolamento del tetto e delle pareti sono relativamente buone. C’è solo un piccolo potenziale di risparmio energetico, di circa il 3-5%, ma è importante evitare una regressione sulla scelta già effettuata.
PES CHART: This is a powerful tool that tells you where you can make improvements to your building and for how to optimize the energy use of your building design. The center vertical line at 0 represents the energy performance of the building model, as submitted for analysis. Bars that extend further to the right of the baseline have higher potential for energy savings. Bars that extend further to the left have higher potential for energy losses. - The most sensitive building features for energy use are the Window Glass, Plug Loads,Roof Insulation and Infiltration. Other important parameters are Building Orientations, Lighting Efficiency, and Wall Insulation.
•The most room for energy improvement is changing the window glass, based on the current building model (~ 35% improvement). The current building model has clear double-pane glazing with a U-value of 3.17, SGHC of 0.69 and Tvis of 0.78.
•The roof and wall insulation specified are relatively good. There is only a small energy savings potential here of 5%, but it’s important to avoid regressing.
MODELLO DI BASE | BASE MODEL:
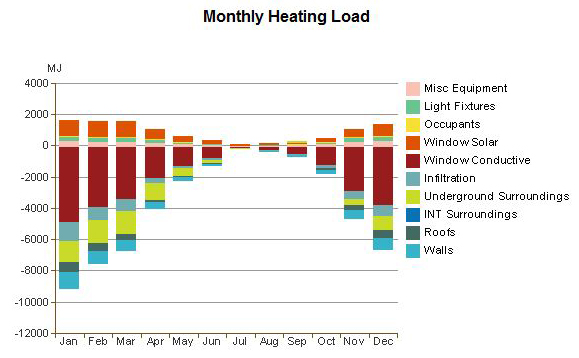
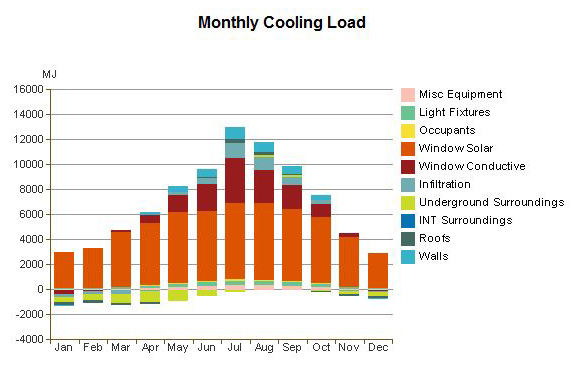
I grafici mostrano la natura della domanda di energia, in particolar modo i mezzi di trasferimento attraverso i quali l’energia termica viene acquisita e persa.
Thermal loads are the quantity of heating and cooling energy that must be added or removed from the building to keep people comfortable. Thermal loads come from heat transfer from within the building during its operation and between the building and the external environment. These thermal loads can be translated to heating loads (when the building is too cold) andcooling loads (when the building is too hot).
The charts show what drives the heating and cooling energy demand. Monthly heating and cooling load charts tell you where heat energy is being gained and lost.
Possiamo vedere come la maggior parte della perdita del calore sia dovuta alla conduttività delle superfici vetrate (Window Conductive), ed in minima parte a causa della dispersione tramite il solaio verso il terreno (Underground Surrondings), e tramite pareti e tetto verso l’esterno. Per quanto riguarda invece i carichi estivi notiamo che la maggior parte del calore che deve essere rimosso viene maggiormente dalla radiazione diretta che incide direttamente sulle finestre (Window Solar), in parte dalla conducibilità termica di queste ultime, da infiltrazioni e dalle pareti.
We can see how the majority of the heat loss is due to the conductivity of the glass surfaces, and in small part because of the dispersion through the slab to the ground, and through walls and roof to the outside. As regards the monthly cooling loads we note that most of the heat that must be removed come from direct radiation falling on windows directly, in part by the thermal conductivity of the latter, by infiltrations and the conductivity of the walls.
A partire quindi dal modello di base dell’abitazione, caratterizzato da un consumo di energia pari a 186 kWh/mq/anno, e collocabile quindi in classe G, cominciamo a fare delle ottimizzazioni energetiche e a registrarne i risultati. Viene anche ipotizzata una distribuzione interna dei locali.
Starting from the basic model, characterized by an EUI of 186 kWh/sqm/year, and then placeable in class G, we start making optimizations energy and record the results. It is also designed a spatial distribution.
L’OTTIMIZZAZIONE | OPTIMIZATION
 0. MODELLO DI BASE | BASE MODEL
 1. OMBREGGIAMENTO FACCIATA SUD | SOUTH FACADE SHADING
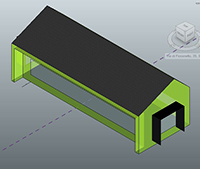
Proviamo ad arretrare la facciata sud rispetto al tetto, di modo che sia il volume stesso ad ombreggiare le finestre: L’ombreggiamento previene surriscaldamenti e riduce così la necessità di raffrescare artificialmente gli ambienti; quindi contribuisce al risparmio energetico.
Try to retreat south facade to the roof, so that the mass shade the windows: shading system prevents overheating and reduces the need for artificial cooling; therefore contributes to energy savings.
 2. APERTURE FACCIATA NORD | NORTH FACADE OPENINGS
Proviamo ora a ridurre la superficie vetrata esposta a nord; essendo la superficie più fredda con meno apporto solare, ridurre la superficie finestrata riduce la quantità di calore disperso d’inverno con conseguente risparmio energetico per il riscaldamento.
Show Mass surfaces, seleziono la facciata vetrata orientata a nord e dalla tabella delle proprietà, Properties-> Energy Model-> By Surface. Riduco il Target Parcentage Glazing da 40% a 20%.
Try to reduce the north glazed area; being the cooler surface with less solar gain, reduce the glass surface reduces the amount of waste heat in winter with consequent energy savings for heating.
Show Mass surfaces, select the glazed facade facing north and from the table of properties, Properties-> Energy Model-> By Surface. Reduce the Target Parcentage Glazing from 40% to 20%.
 3. APERTURE FACCIATE EST E OVEST | EAST-WEST FACADE OPENINGS
Dopo aver ipotizzato un impianto distributivo per il nostro edificio, decidiamo di ridurre la superficie vetrata anche per le facciate Est e Ovest. Queste, a diferenza della facciata sud, pongono maggiori problemi; esse ricevono luce quando la posizione del sole è bassa (mattina, pomeriggio): sono quindi meno facilmente ombreggiabili e spesso la causa di surriscaldamenti. Diminuiamo la percentuale di vetratura dal 40 % al 20 %.
We decide to reduce the glazed area for East and West facades. These ones, unlike the south facade, facing major problems; they receive light when the position of the sun is low (morning, afternoon) and are thus less easily shaded and often cause of overheating. We decrease the percentage of glazing from 40% to 20%.
 4. PROPRIETà DEL VETRO | GLASS PROPERTIES
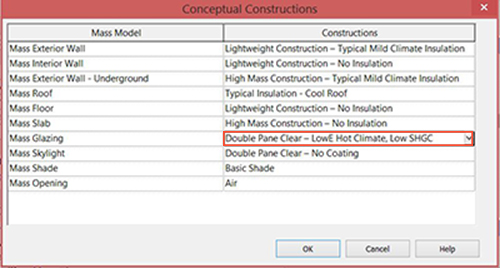
Cambiamo il tipo di vetro da Double Pane Clear - No Coating con Double Pane Clear: LowE Hot Climate - Low SGHC. Questo equivale a cambiare le seguenti proprietà:
Change the type of glass from Double Pane Clear - No Coating with Double Pane Clear: LowE Hot Climate - Low SGHC. This is equivalent to change the following properties:
A) U = 3.17 SGHC =0,69 TVIS = 0,78
B) U= 1.96 SGHC =0.67 TVIS = 0.72
Agisco ora sui parametri riguardanti la costruzione dell’involucro, aumentando non solo l’isolamento, utile a trattenere il calore d’inverno e a rallentarne l’ingresso per conduzione d’estate, ma anche la massa termica , che indica la resistenza del materiale a cambiare temperatura: essa è fondamentale per riscaldare passivamente un edificio, soprattutto in luoghi che hanno grandi sbalzi di temperatura dal giorno alla notte.
Now I am going to act on the construction parameters, increasing not only the useful thermal insulation to retain heat in winter and to slow down its input by conduction in the summer, but also the thermal mass, which indicates the strength of the material to change in temperature: it is critical to passively heat a building, especially in places that have large swings in temperature from day to night.
 5. MASSA TERMICA PARETI | WALL THERMAL MASS
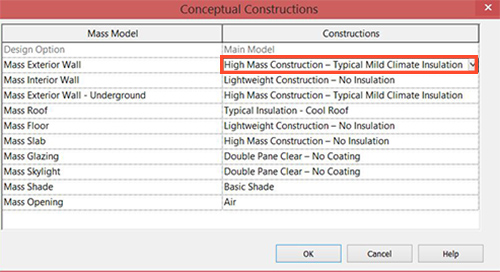
Cambio la massa delle pareti esterne da Lightweight Construction - Typical Mild Climate Insulation ad High Mass Construction - Typical Mild Climate Insulation che equivale a cambiare le seguenti proprietà:
Change mass exterior walls from Lightweight Construction - Typical Mild Climate Insulation to High Mass Construction - Typical Mild Climate Insulation which is equivalent to the following properties:
A) R-Value = 1.73 Unit Density=184.15 Heat Capacity=0.193
B) R-Value =1.91 Unit Density=512.67 Heat Capacity=1.080
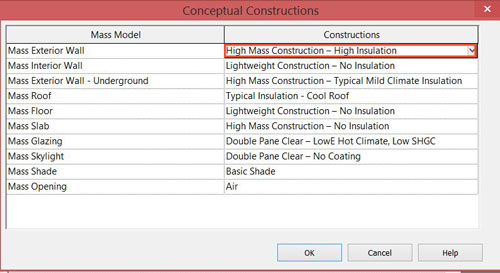 6. MASSA TERMICA E ISOLAMENTO PARETI | WALL THERMAL MASS AND INSULATION
Da High Mass Construction - Typical Mild Climate Insulation a High Mass Construction - High Insulation.
From High Mass Construction - Typical Mild Climate Insulation to High Mass Construction - High Insulation.
A) R-Value =1.91 Unit Density=512.67 Heat Capacity=1.080
B) R-Value =2.91 Unit Density=495.67 Heat Capacity=1.116
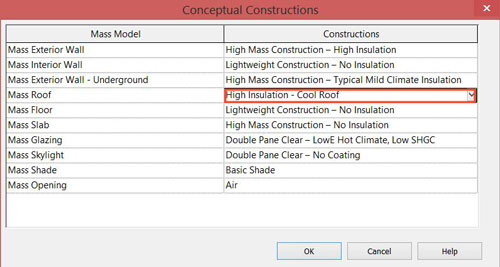 7. ISOLAMENTO COPERTURA | ROOF INSULATION
Da Typical Insulation - Cool Roof a High Insulation - Cool Roof.
From Typical Insulation - Cool Roof to High Insulation - Cool Roof.
A) R-Value =3.87 Unit Density=73.04 Heat Capacity=0.123
B) R-Value =5.63 Unit Density=108.25 Heat Capacity=0.158
Schermiamo le vetrate ad est e ovest (stiamo supponendo che ci siano aperture nella camera da letto e nello studio) prima orizzontalmente poi verticalmente così che possano comunque favorire l’ingresso della luce evitando l’abbagliamento e apporti solari indesiderati.
Shade the east and west windows (assuming that there are openings in the bedroom and the office) horizontally and vertically so that useful light can access avoiding glare and unwanted solar gains.
 8. SCHERMATURE ORIZZONTALI FACCIATE EST-OVEST | EAST-WEST FACADE HORIZONTAL SHADING
 9. SCHERMATURE VERTICALI FACCIATE EST-OVEST | EAST-WEST FACADE VERTICAL SHADING
 10. CREAZIONE DI UN SOLAIO CON INTERCAPEDINE | EAST-WEST FACADE VERTICAL SHADING
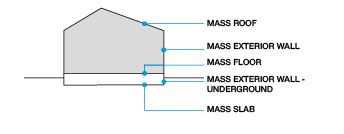
Sapendo che il solaio di calpestio (Mass Floor) non sarà a diretto contatto col terreno, ma sarà un solaio areato con un’intercapedine, cerco di effettuare una modellazione più accurata: prolungo la massa dell’edificio verso il basso oltre il piano di riferimento +0,00, relativo al livello del terreno. Vado a creare quello che per Vasari è un “Unconditioned space”. Automaticamente le superfici vengono riconosciute come interrate acquisendo le proprietà di Mass Exterior Wall Underground e Mass Slab (come definite in Energy Settings):
Mass Floor won’t be in direct contact with the ground, but it will be a ventilated slab with a gap, so I try to model it more accuratly: stretch the building mass down over the reference plane +0.00, relative to ground level. I’ll create an “Unconditioned space”. Automatically surfaces are recognized as underground acquiring Mass Exterior Wall Underground and Mass Slab properties (as defined in Energy Settings):
Compariamo ora tutti i risultati registrati man mano, cercando di capire qual è l’impatto energetico di ogni singola ottimizzazione e della somma di queste rispetto al modello enrgetico iniziale.
Now compare all the recorded results to figure out what is the energy impact of each optimization and the sum of these compared to the initial energy model.
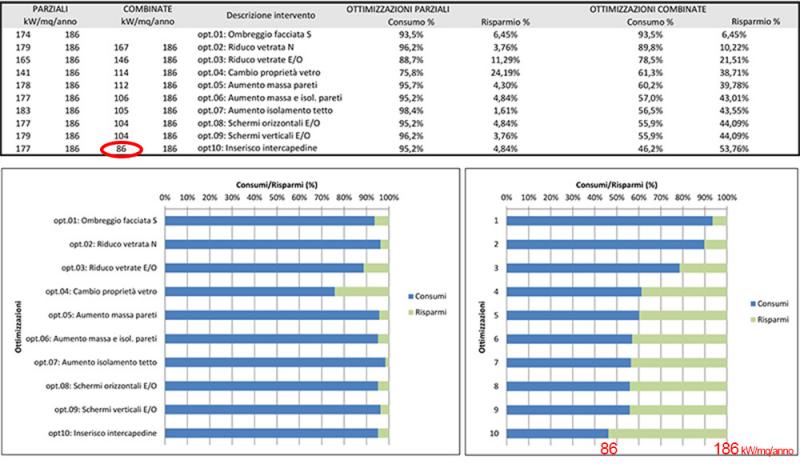
Osservando le PES CHARTS relative al prima e dopo l’ottimizzazione vediamo che effettivamente c’è stato un risparmio e i margini di migliorabilità si sono sostanzialmente abbassati.
Observing PES CHARTS before and after the optimization, we see that there was a savings and improuvement possibilities were substantially lowered.
Sappiamo che l’obiettivo di una corretta progettazione la realizzazione di un edificio NET ZERO ENERGY - quando l’edificio è l’energia efficiente e genera abbastanza energia in loco per eguagliare il proprio fabbisogno energetico annuale.
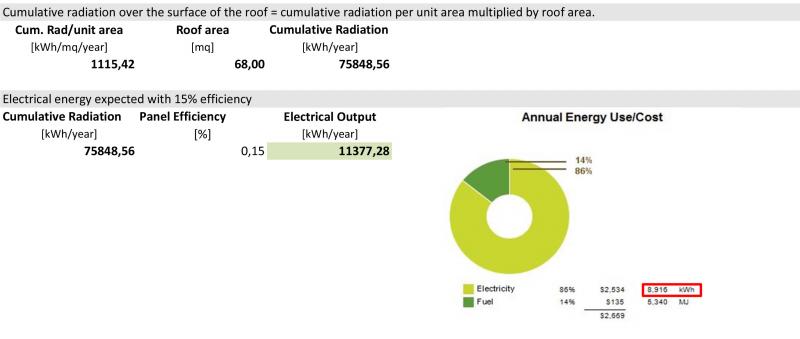
Ipotizzando, quindi, di istallare dei pannelli fotovoltaici sulla copertura esposta a sud, conduco un’analisi della radiazione solare e stimo la produzione fotovoltaica annuale in KW. Infine confronto questo valore col fabbisogno annuale di energia.
An increasingly popular goal for green building is achieving NET ZERO ENERGY - when your building is energy efficient and generates enough energy on-site to equal its annual energy needs.
Assuming to install photovoltaic panels on the roof facing south, I will conduct a solar radiation analysis estimating the annual PV production in KW. Then I’ll compare this value with the annual electrical energy demand.
CALCOLO DEL POTENZIALE FOTOVOLTAICO | PV POTENTIAL CALCULATION
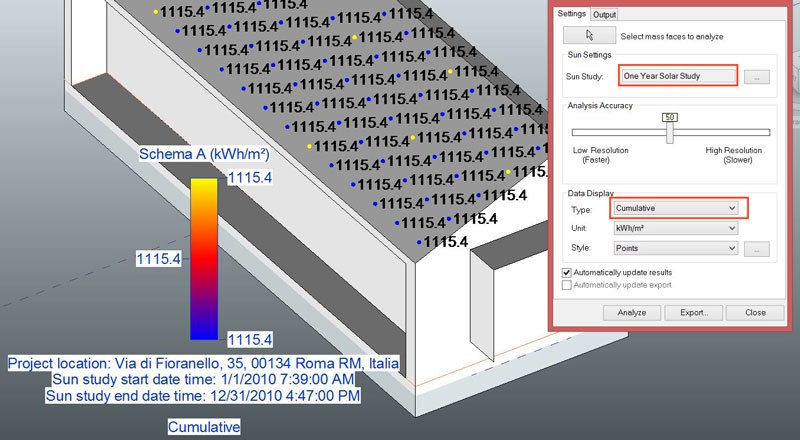
Da Analize-> Solar Radiation; è importante condurre un’analisi cumulativa relativa a un periodo di un anno. Selezionata la falda in esame seleziono Sun Study-> One Year Solar Study, Type-> Cumulative e Unit-> kWh/mq.
From Analize-> Solar Radiation; it is important to conduct a cumulative analysis on a one year period. Select the roof then Sun Study-> One Year Solar Study, Type-> Cumulative and Unit-> kWh /sqm.
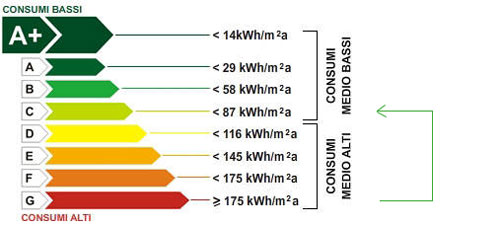
Mediante una modellazione attenta e consapevole riduciamo di più della metà il fabbisogno iniziale, passando da una classe di consumo medio-alto (G) a una di consumo medio-basso (C).
With a conscious modeling we reduce more than half the initial energy demand, from a medium-high energy demand class (G) to a medium-low one (C).
"I risultati delle simulazioni sono utili solo se li si analizza e li possono utilizzare per migliorare il progetto. Ciò significa confrontare continuamente i risultati che si ottengono con altre alternative progettuali, le buone pratiche e i risultati attesi. E' importante prestare attenzione al modello e ad anomalie nei risultati, individuare la sensibilità dei parametri di progetto, e comprendere il ruolo delle varie parti dei sistemi. L’ analisi dovrebbe concentrarsi sulla comprensione ed il miglioraramento delle variabili che guidano le prestazioni e il costo del progetto: gli strumenti forniscono le informazioni ma poi è necessario saper interpretare e prendere decisioni appropriate." Dal (BPAC) Program - Building Performance Analysis Certificate Program
"The results of your simulation are only useful if you analyze them and can use them to improve the design. This means comparing your results with other design options, industry baselines and best practices, and your expected results.
It’s important to pay attention to patterns and anomalies in the results, identify sensitivity of design parameters, and understand the role of various parts of the systems." From (BPAC) Program - Building Performance Analysis Certificate Program