


 Blasi_Elia
Lun, 27/04/2015 - 16:40
Blasi_Elia
Lun, 27/04/2015 - 16:40
In this delivery we have studied the solar radiation on the spaces, the facades and the glass surfaces of one of the buildings of our first exercise, in order to value positive and negative aspects.
We share below the procedure followed to continue modeling through the definition of particulars on the facade and to do a more accurate solar analysis.
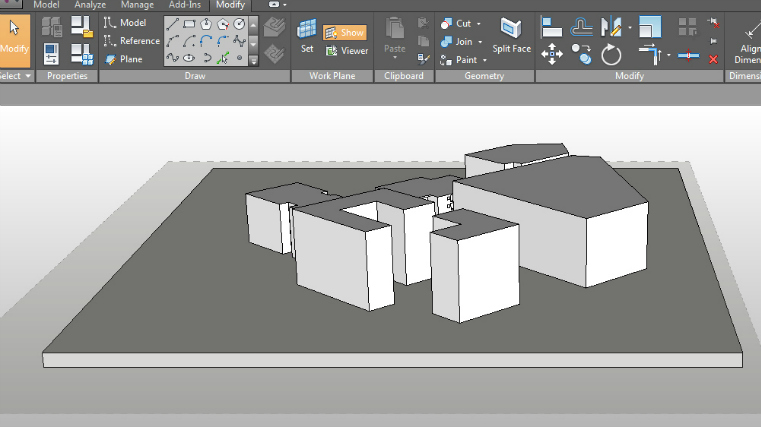
Step 1: Drawing the ground floor
Once you have created the masses that represent the buildings, now create the ground as a simple parallelepiped, which the volumes are based on. Do this in order to analyse, later, the solar radiation on the open spaces defined by the buildings.
Step 2: Drawing the details
In order to add a building’s details, click on MODIFY MASS > EDIT IN PLACE.
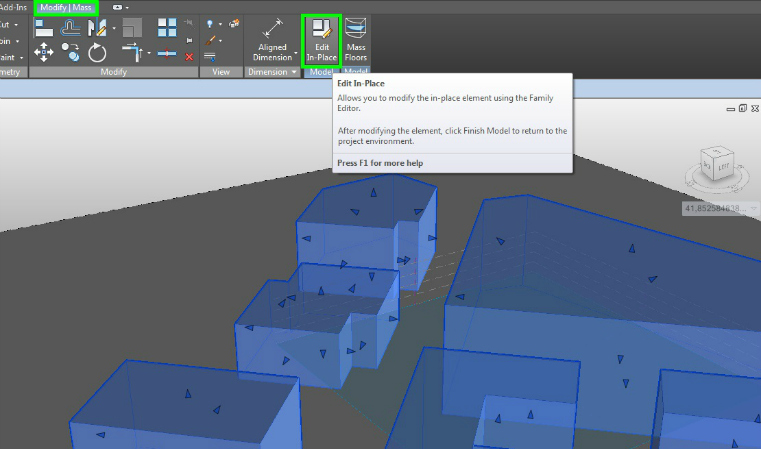
Be sure to set the right work plane, draw the figure that you want to represent: you can move it and also adjust the dimensions by clicking on them.
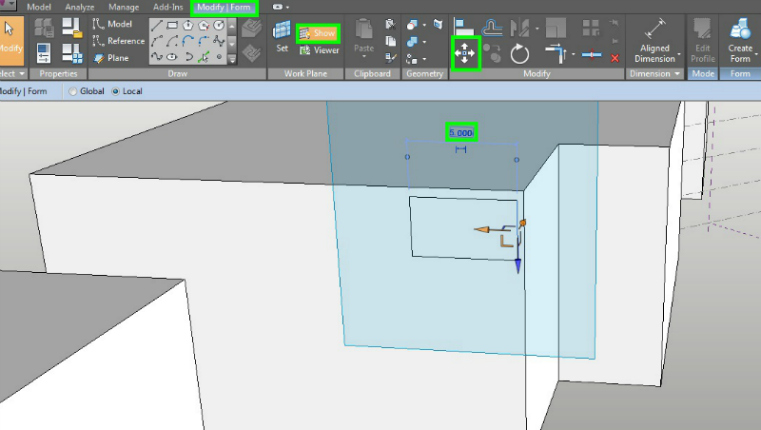
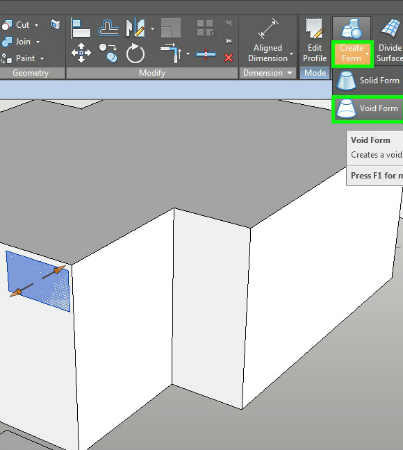
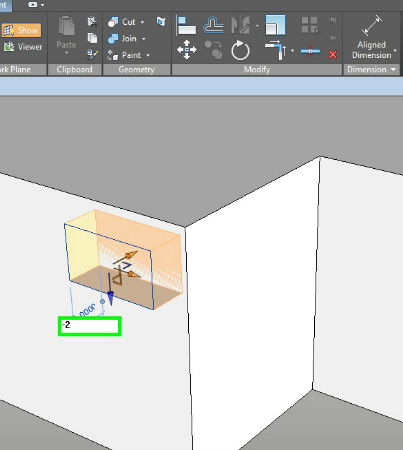
Click on CREATE FORM > VOID FORM and extrude towards the interior with the chosen measure.
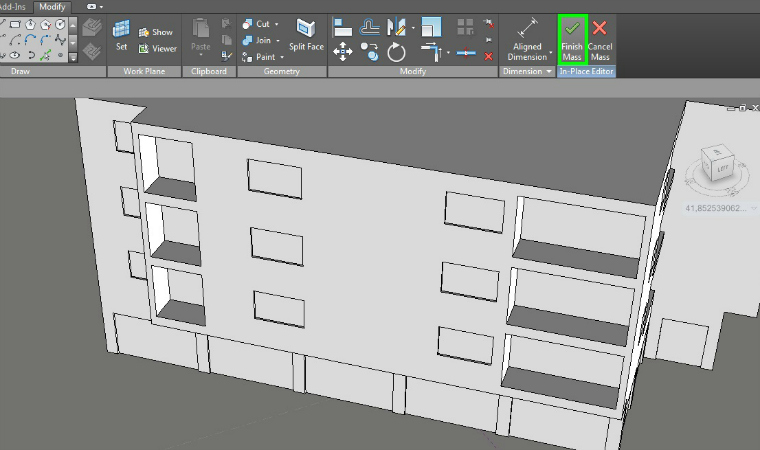
Once you have realized all the details, to complete the modeling click on FINISH MASS
Step 3: Set the solar analysis
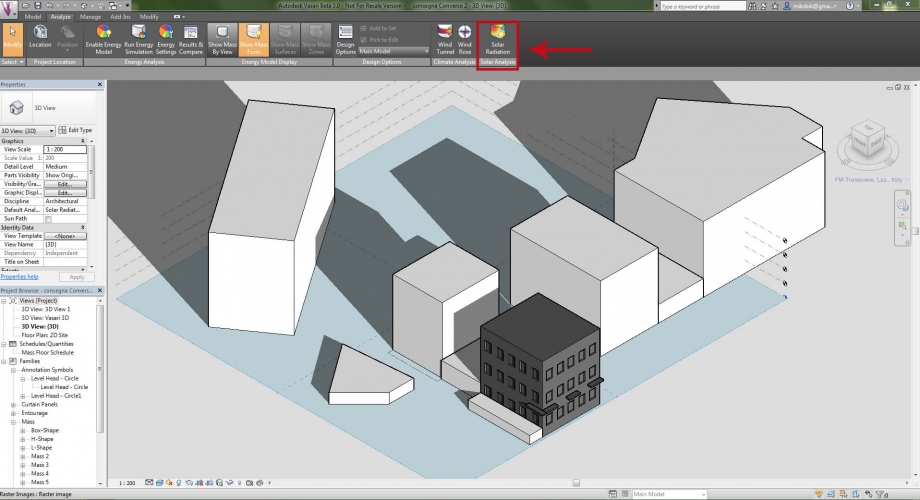
Click on ANALYZE > SOLAR RADIATION > SETTINGS to set up all your preferences of analysis.
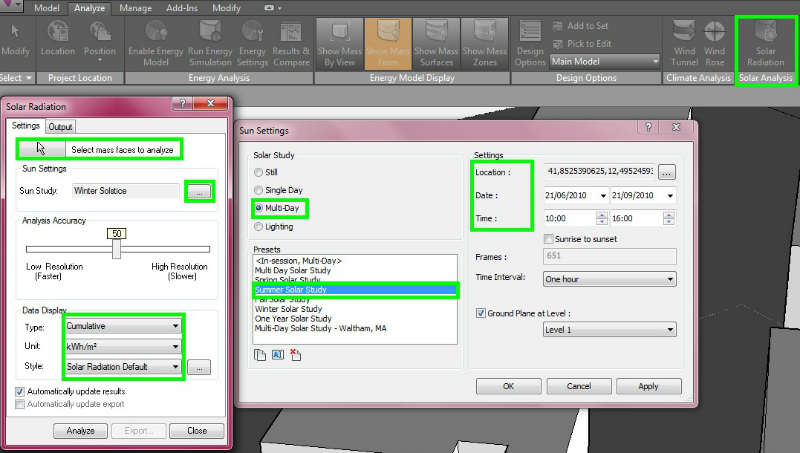
- First, select the facades you want to analyse.
- Then, set the period of the analysis (Multy Day > Summer Solar Study or Winter Solar Study) and check location, date and time.
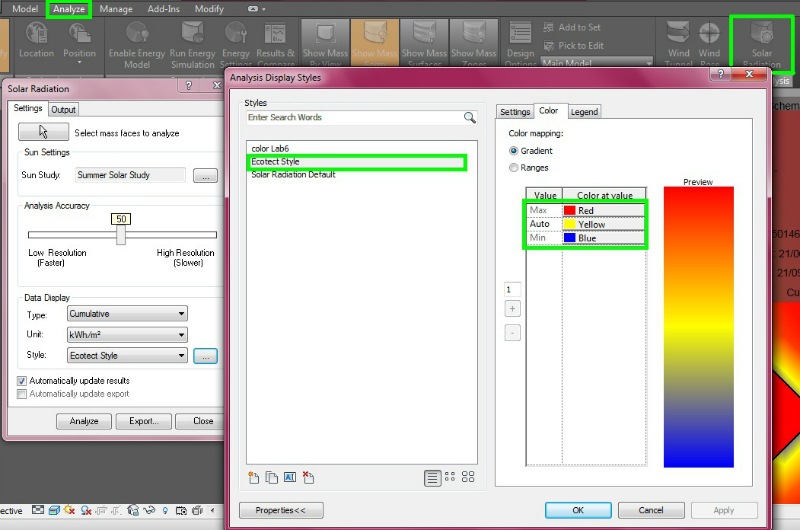
- In DATA DISPLAY, set the type (Cumulative), the unit (KWh/m2) and the style of the analysis. You create a new style, or you can modify the default styles (for example “Ecotect style”).
Step 4: Our solar analysis of the open spaces
We’ve thought that the best way to analyze the radiation on the buildings is choosing the hottest hours of the day during the most significant and different seasons of the year, winter and summer.
Summer and winter solar study
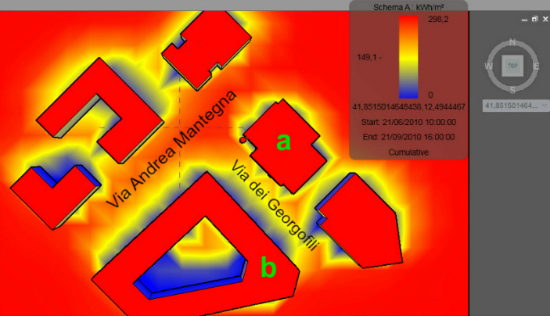
We have analyzed how many radiations our building (a) and the near ones accumulate, in order to observe if the exposition is useful for a comfortable livability of the open spaces. What we observed is that, due also to its width, Via Andrea Mantegna receives a lot of solar radiation during this period: this might be a problem during summer, because the high temperature of the asphalt can seriously influence the temperature at the street level.
 Summer
 Winter
We have considered significant to analyse also the courtyard of the building we called b and the way its internal facades accumulate the solar radiation: we observed that the two facades exposed to South-East are a lot more radiated than the ones exposed to North-West; also, inside the courtyard there isn’t any tree that could cast its shadow over the walls, so probably the South-East facades become pretty hot during the days of summer.
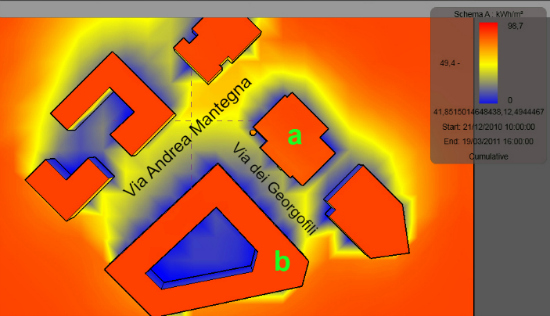
On the other hand, during winter not only the North-West facades receive little radiation, but also the first floors of the South-East facades, so the interior might result pretty cold.
South-East facades, summer South-East facades, winter
North-West facades, summer North-West facades, winter
Focusing on our building, we have analysed the North-West facade (the one on Via Andrea Mantegna) and the South-West facade (on Via dei Georgofili): we can notice that, both in winter and summer, the first one is not really radiated because of its exposition; the balconies are very little radiated, because they are not projecting but are arrears in the volume, and also the shops’ windows on the ground floor receive little radiation because of the overhang above them.
Otherwise, the South-West facade is a lot more radiated: during summer, despite the floors of the balconies are really sunny (about 160Kwh/mq), their inner walls seem to be well shielded; during winter, the portion of the facade arrear from the road is a lot less radiated than during summer, because of the shadow of the nearby wall and of the frontal tree.
North-West facade, summer
North-West facade, winter
South-West facade, summer South-West facade, winter
Step 5: Our solar analysis of the glass surfaces
Click on ANALYZE > SOLAR RADIATION > SETTINGS to set up all your preferences of analysis:
- First, select the glass surfaces you want to analyse.
- Then, set the period of the analysis (Multy Day > Summer Solar Study or Winter Solar Study) and check location, date and time.
- In DATA DISPLAY, set the type (Cumulative), the unit (KWh/m2) and the style of the analysis. Create a new style setting as display stile Markers with text and giving it a name (“Numerico lab6”).
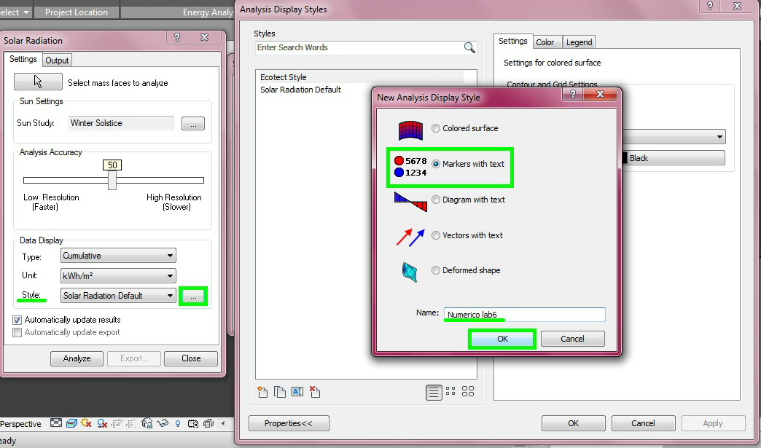
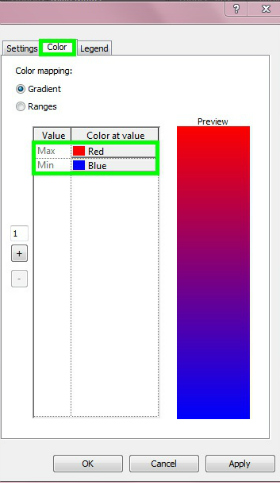
You can now modify settings, colour (max = red, min = blue) and legend of your new style.
It’s possible to change the density of the numeric indicators of the radiation by setting the “Analysis Accuracy” or to change the display scale in case the informations on the model result too big (or too little).
Summer and winter solar study
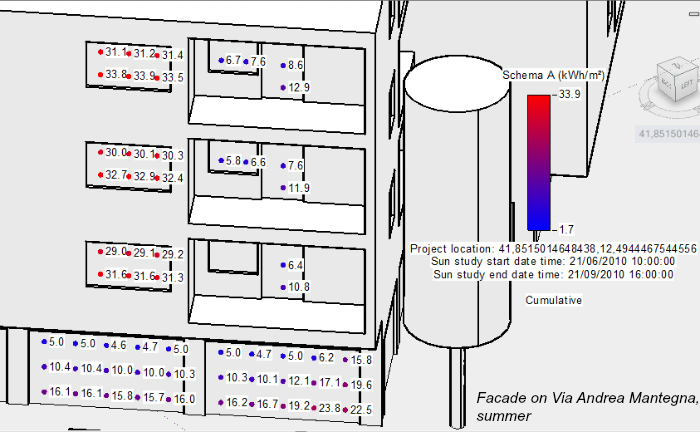
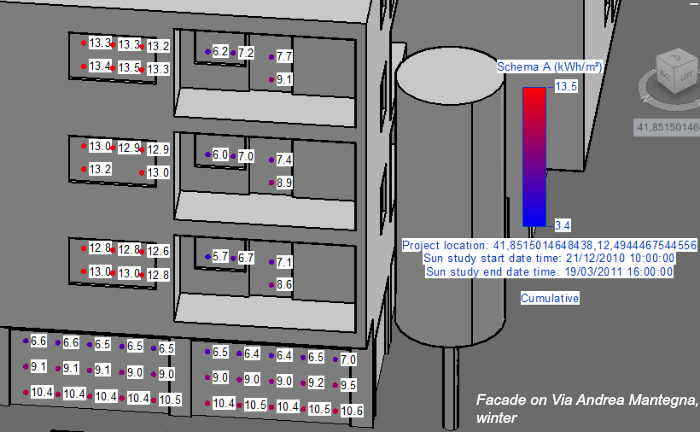
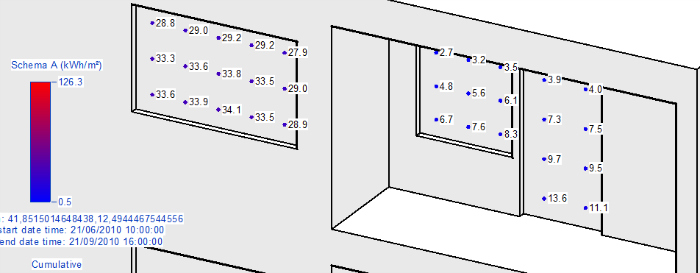
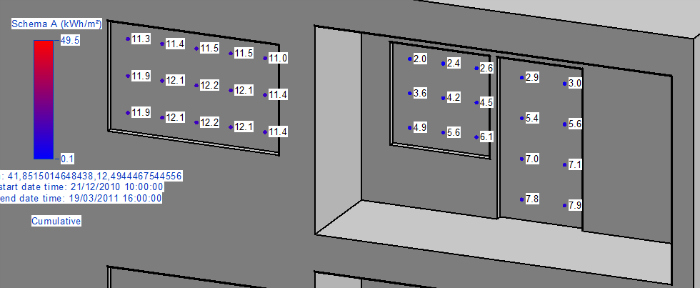
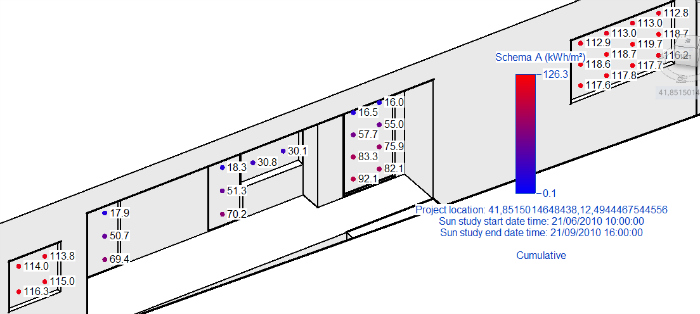
We have considered a portion of the facade of Via Andrea Mantegna. Thanks to the numeric analysis of the solar radiation on the glass surfaces, we can notice first of all that the range of values of the radiation is more restricted, because the facade is exposed to North-West (the exposure, as pointed out before, implies a lower radiation accumulated).
Also, we can see that on the shops' windows the amount of radiation decreases as we approach the overhang.
Finally, there is an important difference of radiation between the windows on the left, which don't have any overhang to protect them, and the glass surfaces on the right inside the balconies.
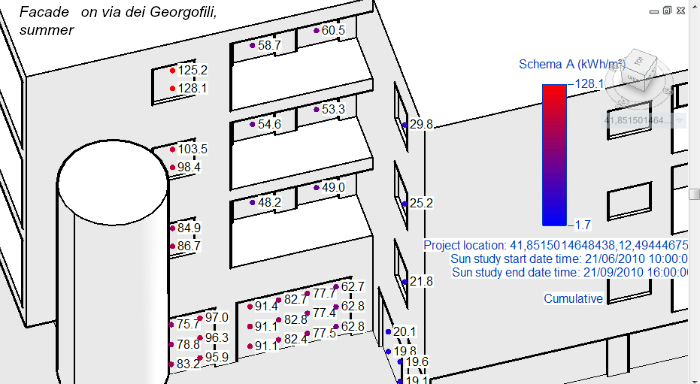
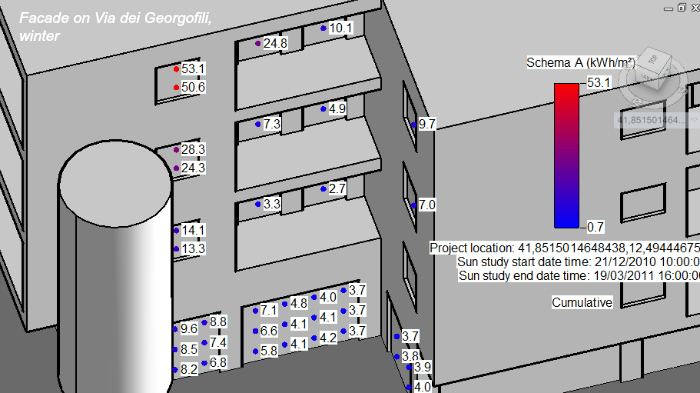
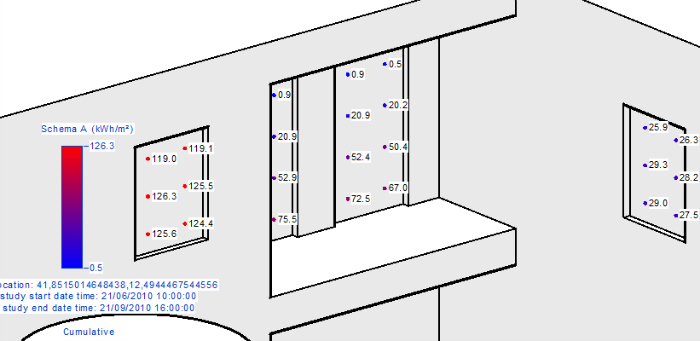
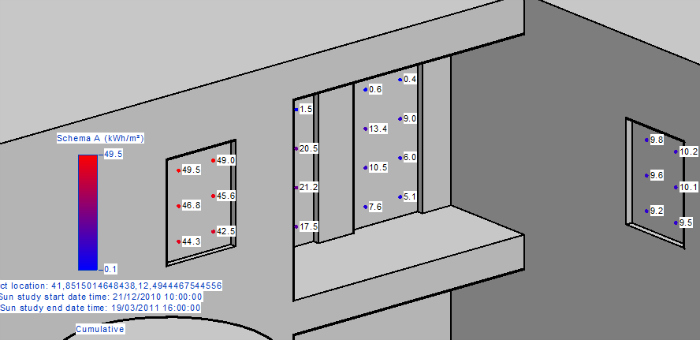
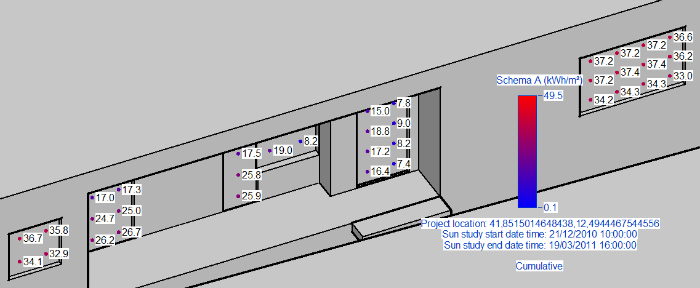
Then we have considered the portion of facade on Via dei Georgofili that is arrear from the road. First of all, the windows exposed to North-West receive a lot less radiation than the glass surfaces exposed to South-West.
Besides, also here it's significant the different amount of radiation between the windows on the left and the glass surfaces on the right inside the balconies. Lastly, we can notice the influence of the presence of the tree, whose shadow causes a remarkable decrease of the radiation on the lower windows.
Detail - Facade on Via Andrea Mantegna, summer
Detail - Facade on Via Andrea Mantegna, winter
Detail - Facade on Via dei Georgofili, summer
Detail - Facade on Via dei Georgofili, winter
Detail - Facade on Via dei Georgofili, summer
Detail - Facade on Via dei Georgofili, winter
Step 6: Final considerations about the comfort and the state of conservation of the building
To bring out the possible critical points of the building where there could be deterioration, we have clicked on ANALYZE > SOLAR RADIATION > SETTINGS, and then we've set "One year solar study" as the period, and "Sunrise to sunset" as the time of the analysis
We have selected the balconies in order to understand what parts of the walls could be subject to mold and humidity because of a bad exposition or a low radiation during the whole year.
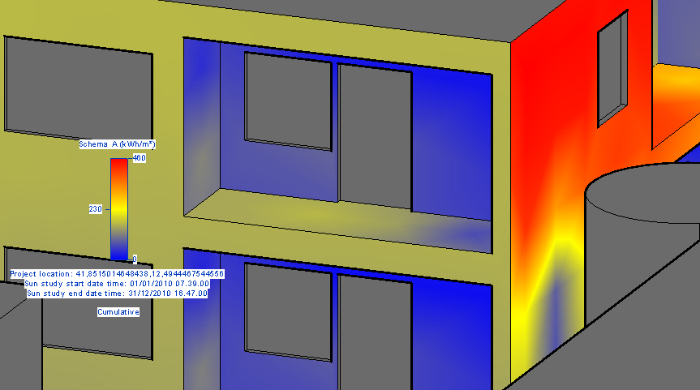
North-West facade: the radiation scale goes from 0 and 460 Kwh/mq
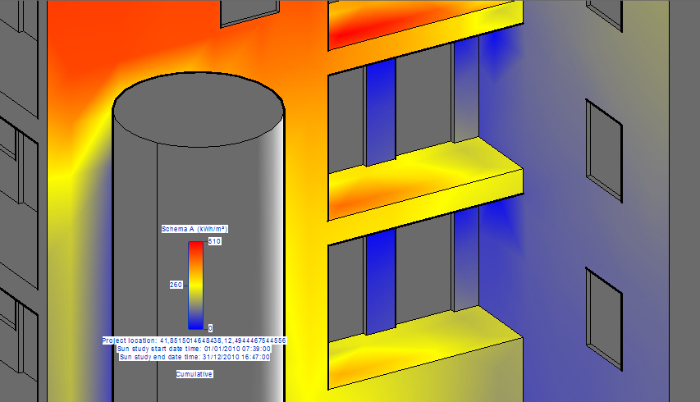
South-West facade: tha radiation scale goes from 0 to 510 KWh/mq
The analysis pointed out that the most problematic areas are the ceiling and the high parts of the inner walls (as we showed in the previous study, they receive less radiation both in summer and in winter): in the specific, the balconies of the North-West facade on Via Mantegna seem to be unlivable during winter, so also the the rooms that look out on them result pretty cold. On the part of the facade on Via dei Georgofili, however, the situation is a bit different, because the balconies are still low radiated, but the whole surface of the building receives a lot more sun during the year, because it's exposed to South-West. So, it seems to be more useful having cold balconies during summer, because they can refresh the rooms inside, as also the shadow of the tree in front of that part of the wall.
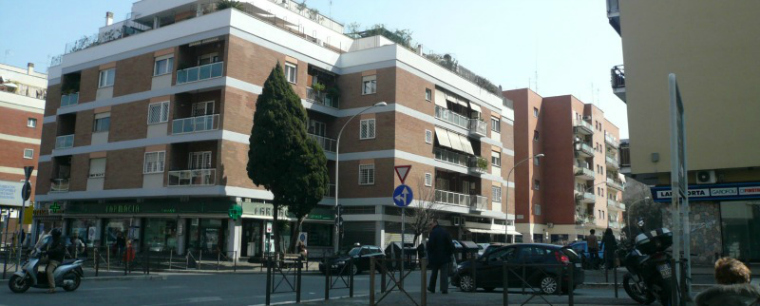
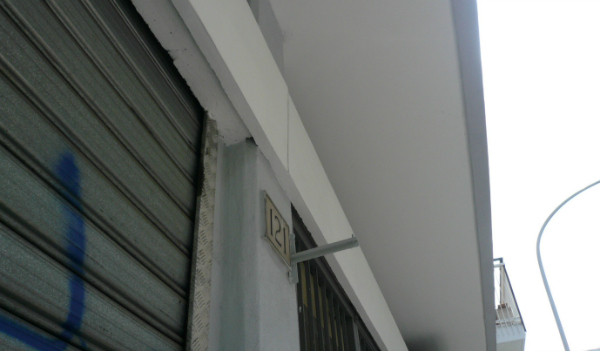
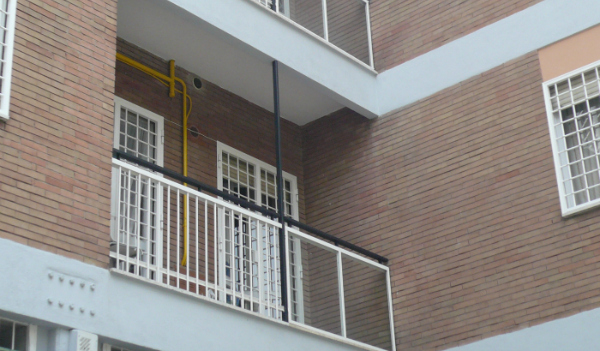
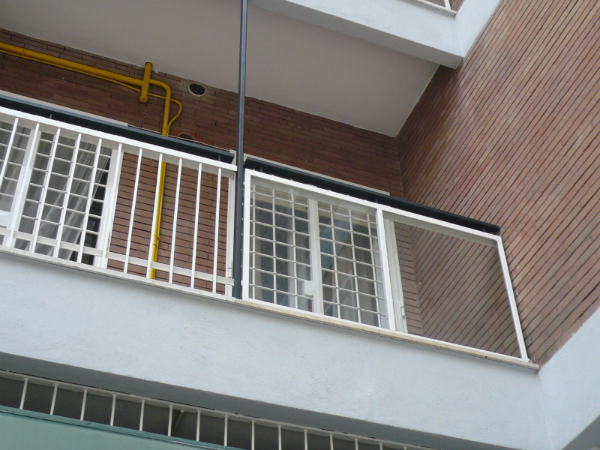
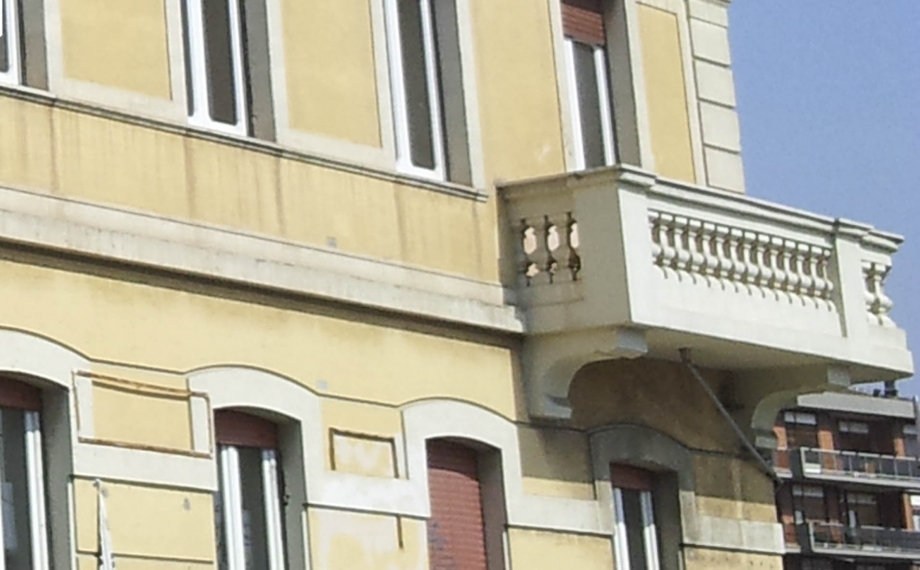
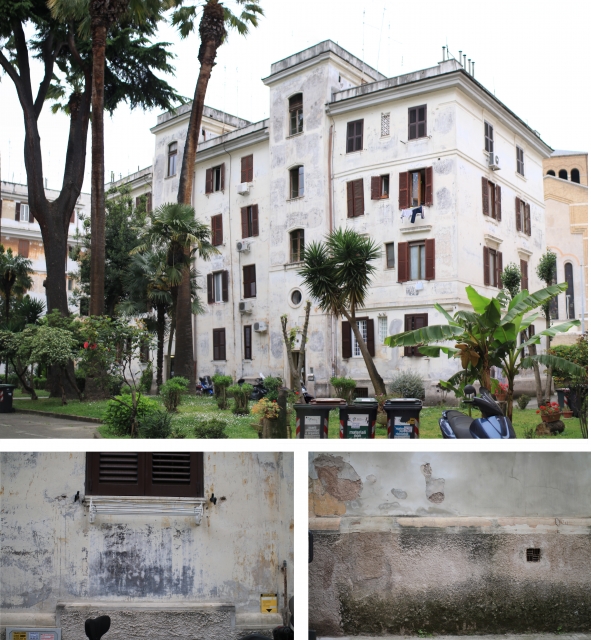
Taking some pictures of our building, we haven't founded any of the problems that we expected: our facades present curtain brick walls without dark spots and with tiny and well grouted joints, which don't allow water infiltrations. Besides, both the faceplate and the upper travertine threshold have good anti-drips which avoid the water flow along the walls.
Here some photos that show the good conservation of the building envelope.
PART 2
1. ANALYSIS OF THE PROJECT'S AREA
Our project is located next to the 13° district of Rome, Trastevere, near the First Municipio, on the West side of the Tevere and in the South of Vatican's City: it overlooks on Via Portuense on the East and Trastevere Boulevard on the West, and presents a 6 meters high drop between the two streets.
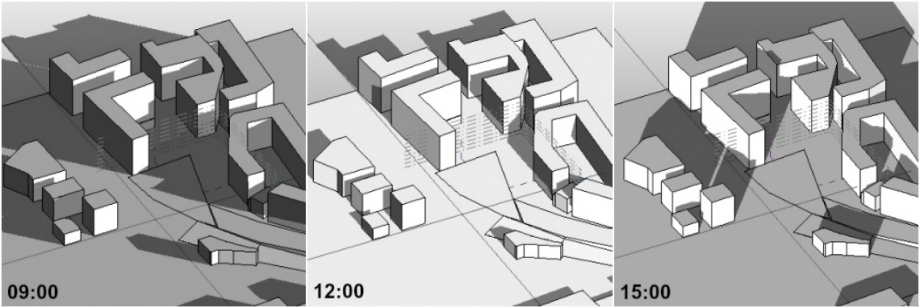
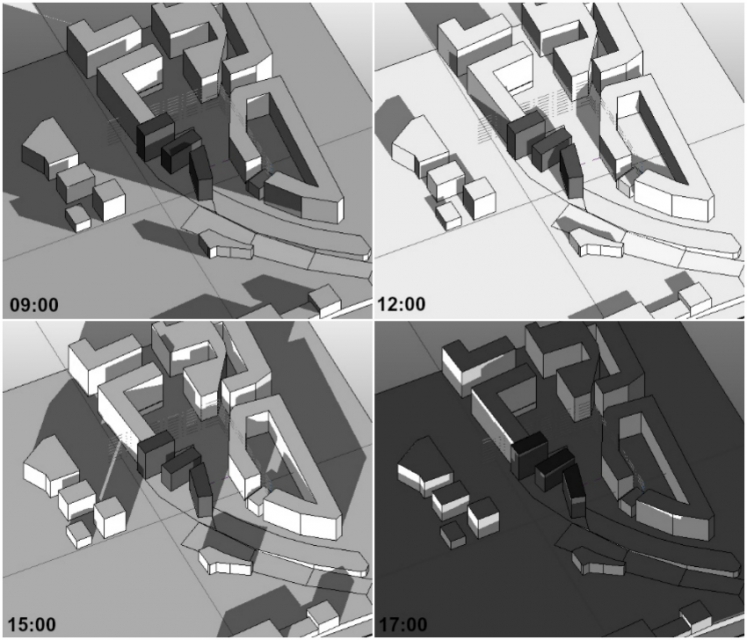
First of all, we have analyzed the shadows of the buildings around our area (that we kept at a +6meters height) without the hypothetical project inside, to understand how much sun it receives during the two most significant and different moments of the year, the summer and the winter solstice:
 Summer solstice
We can notice how, in the central and hottest hours of the day, the area is always sunny, because none of the buildings around cast its shadow over it: this influences the solar radiation, which highlights very high values for the area, practically the highest of the zone, with peaks around 410 KWh/mq.
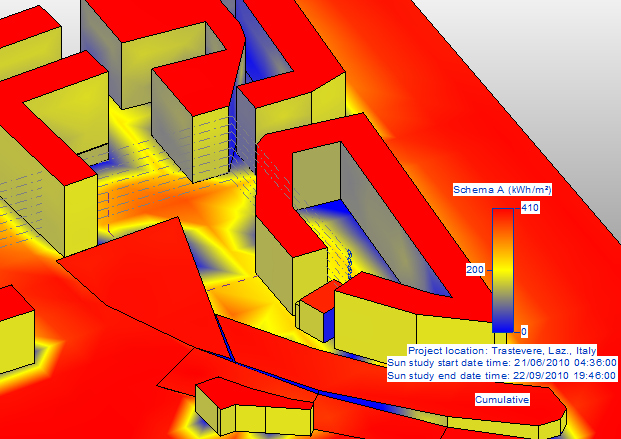 Summer solar radiation
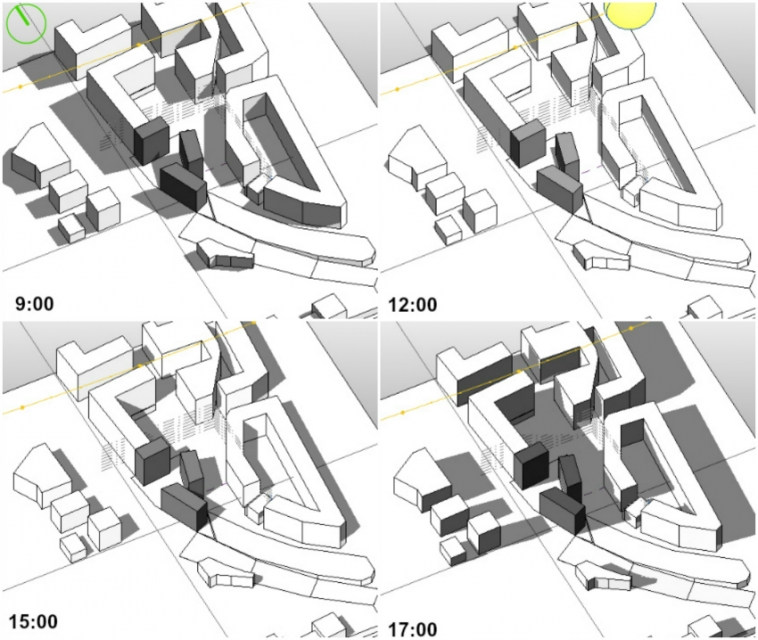
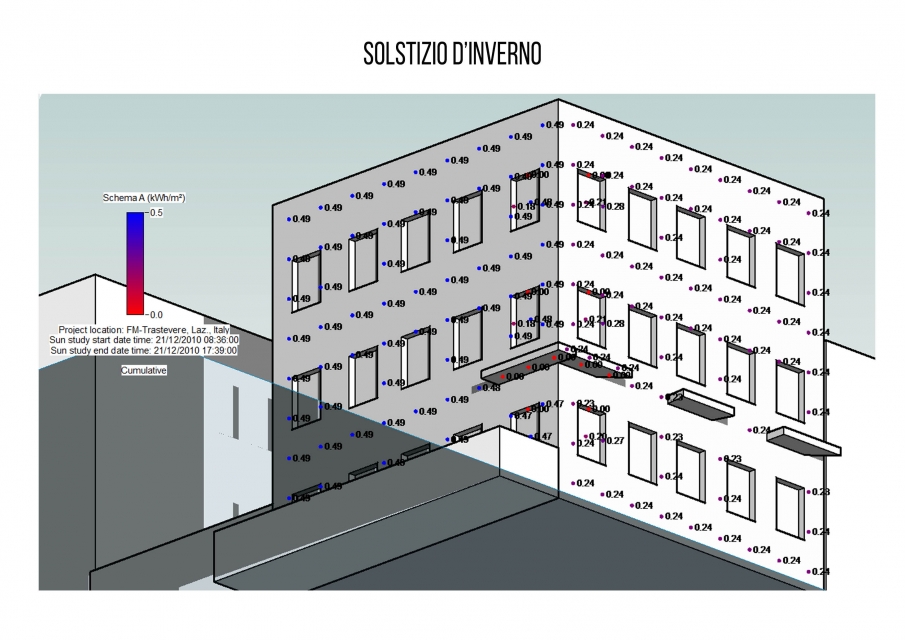
Winter solstice
In winter, we can notice that the situation is pretty different during the first hours of the morning, when the buildings on the East cast their shadows over the area (during the last hours of the afternoon the situation is probably the same because of the shadows of the buildings on the West side): whereas, the area remains sunny during the central hours of the day, as we can see from the analysis of the radiation, which highliths high values around the 80 KWh/mq.
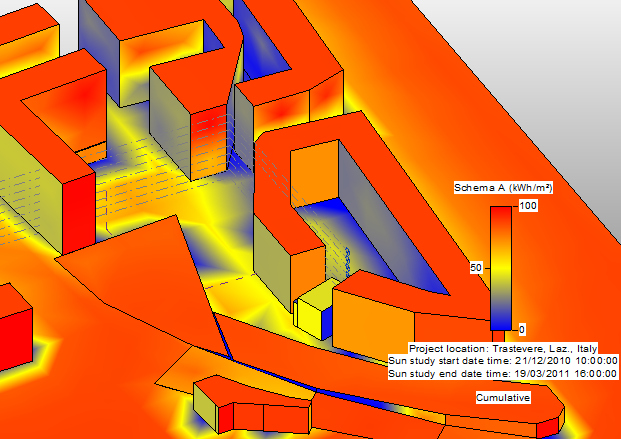 Winter solar radiation
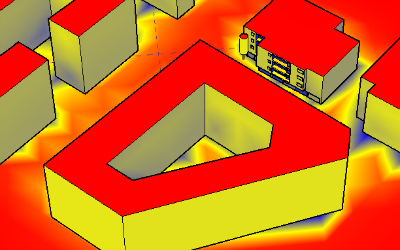
We present now our two project's ideas, with the analysis of the shadows during summer and winter: infact our intention is to create open spaces which could be as livable as possible and which could represent common points of interest and meeting for the users of the project. In our opinion, the most important thing is to guarantee a good illumination and radiation for the whole area, both in summer, when you need fresh open spaces and shielding systems for the facades of the buildings, both in winter, when it's an advantage to have sunny facades and warm open spaces.
Our two ideas present both a project made by three different volumes, which create a fluid sequence of open spaces; also, we haven't solved yet the altitude difference of the area, so it's important to consider that both the projects are located at a height of +6 meters.
IDEA N°1
 Summer solstice
We can notice that the most significant problem of this first disposition of the three volumes is that the principal open space, which we can call the "square", is sunny for the most part of the day, even if the other smaller open spaces are shaded and probably fresh. The most exposed facades of the central bulding seem to be shades for most of the day, while the West and South facades of the other two volumes are the most problematic, because they are sunny during the hottest hours of the day: so, we are considering a good shielding system for them.
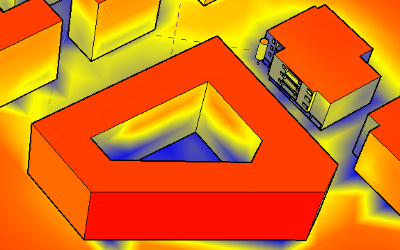
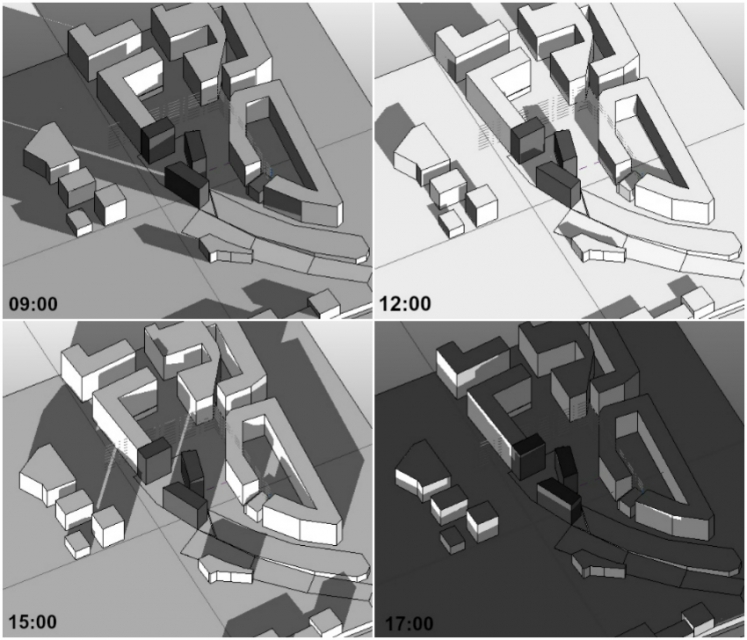 Winter solstice
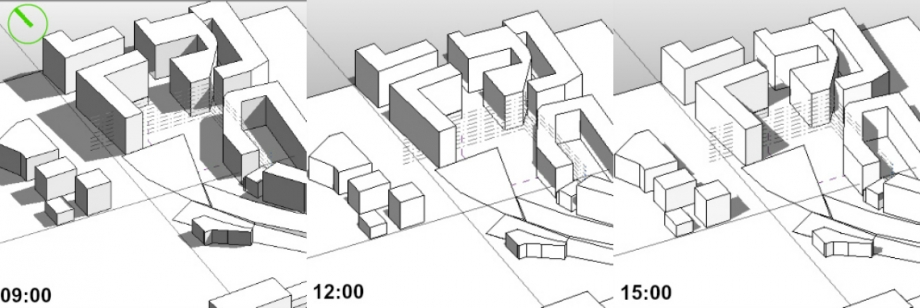
During winter, the analysis highlited an important problem of the project: the open spaces seem to be in fact shaded for the whole morning, because they receive the shadows of two of the three volumes. This could mean a pretty wet and cold outside, certailny not comfortable in winter. The situation evolves during the central hours of the afternoon: at 15:00 o' clock, in fact, a good portion of the square is sunny, because there aren't shadows from West.
For what concernes the facades of the buildings, they are pretty well exposed, with the exception of the central volume, whose West facade receives the shadows of the other one for almost the whole day. We are thinking about a different height of the three volumes to solve these problems.
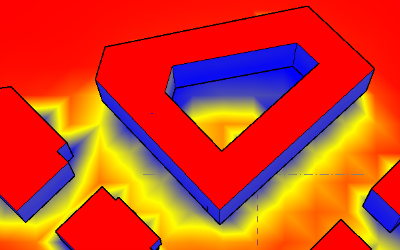
IDEA N°2
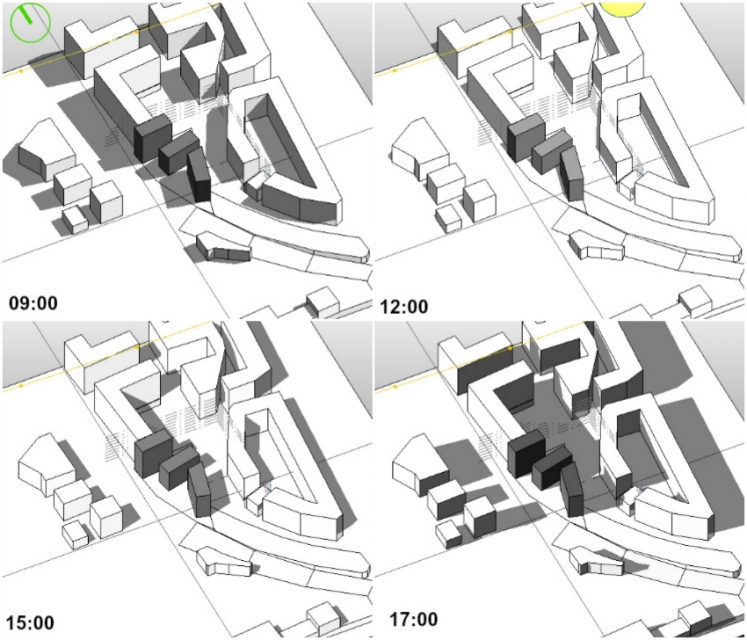 Summer solstice
Here the three volumes are placed in a different way: the biggest problem are the open spaces during summer, sunny for the whole afternoon, and the South and West facades, which are exposed to sun for great part of the day: to avoid these problems, it could be possible to project a system of overhangs, that can articulate the outside and also create shadows on the ground.
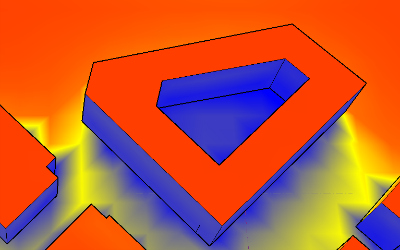
 Winter solstice
This disposition presents instead a better solution for the winter, because here we can see that the open spaces are sunny for a good part of the day (as pictures at 12:00 and 15:00 show), so the outside is supposed to be warm and probably makes also the temperature of the surrounding air more enjoyable. Besides, also the facades seem to be well exposed and radiated, while in the other idea the central volume is more shaded for most part of the day.
2. CHECK OF THE PROJECT'S QUANTITIES
Now we can verify the dimensions of our projects and be sure that they fit the project's requirements. We have choosed the first idea to show the different steps to do the analysis.
Step 1
Go on MODYFY > LEVEL to create new levels or to modyfy the the existent ones:
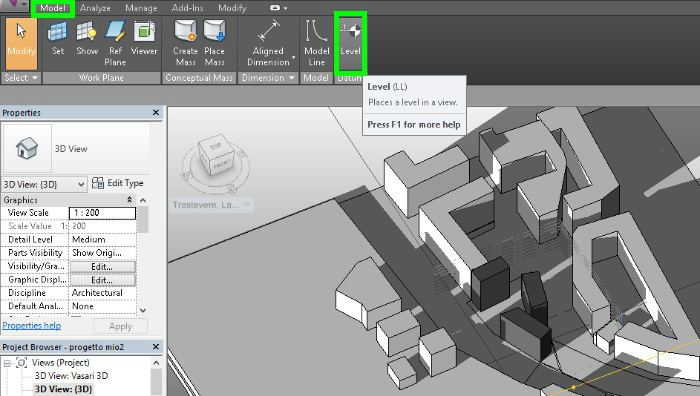
Remember that, opening the Properties of the level, you can modify his height (in "Elevation") and name (in "Identify Data").
Step 2
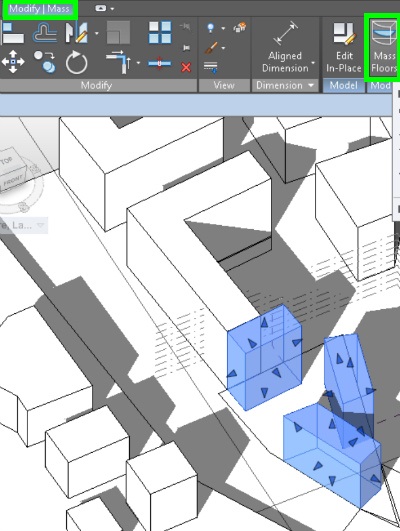
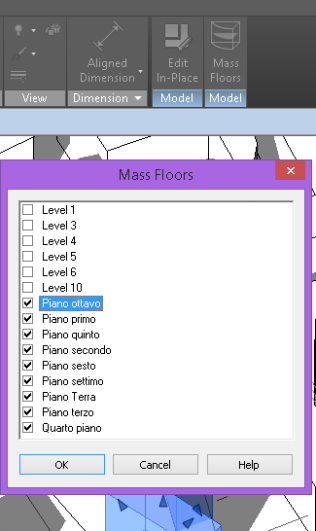
Select the mass that you are analysing and click on MODIFY|MASS > MASS FLOORS: it will automatically open a window where you have to tick all the levels which represent the floors of your project.
Step 3
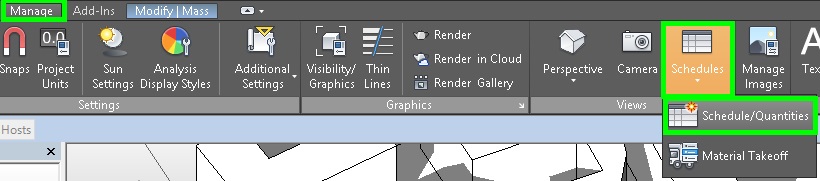
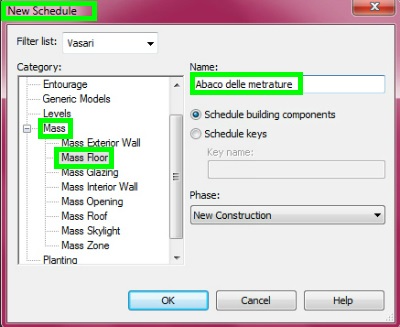
Select your mass and click on MANAGE > SCHEDULES > SCHEDULE/QUANTITIES: it will open the window NEW SCHEDULE where you can rename your schedule (for example as "Abaco delle metrature") and select MASS > MASS FLOOR.
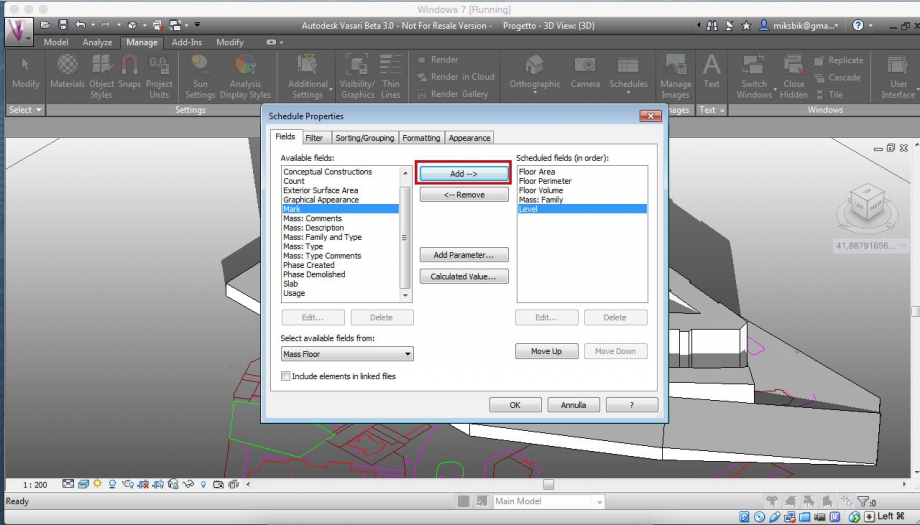
Click "OK" and on SCHEDULES PROPERTIES select the fields you want to analyse. In our study, we selected Floor Volume, Floor Area, Floor Perimeter and Level, clicking on "Add" and then on "OK".
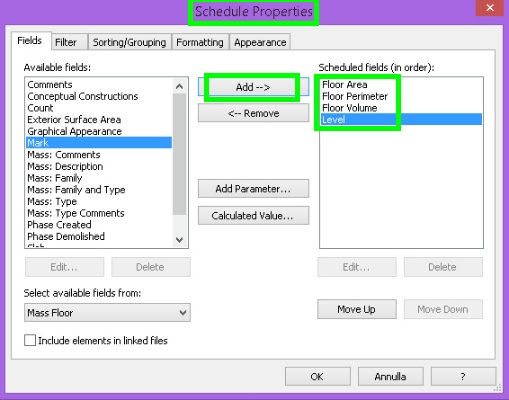
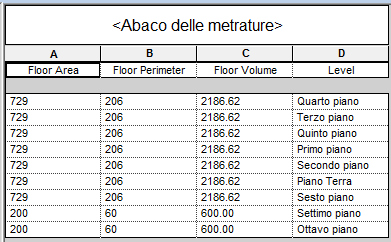
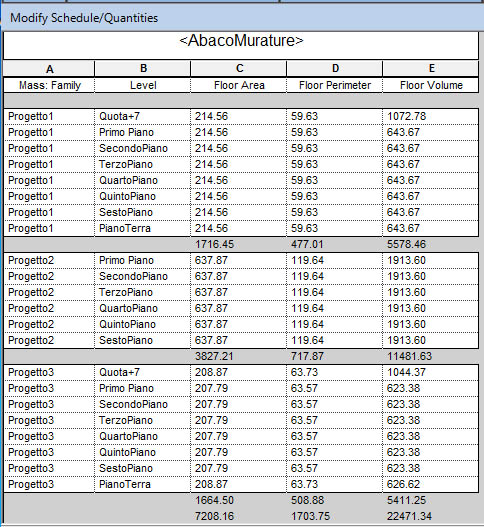
From the previous operations Vasari will elaborate a schedule with all the properties you have choosen before. In our case of study, the project has to develop a surface of about 5600 mq. The schedule highlights that the total amount of area is 5503 mq, which is an acceptable value.
Ven, 24/04/2015 - 14:08
 Bambina_Roefaro
Ven, 24/04/2015 - 12:54
Bambina_Roefaro
Ven, 24/04/2015 - 12:54
1. SOLAR RADIATION
In questa seconda consegna l'obiettivo è quello di studiare le radiazioni solari e gli gli effetti che comportano sull'edificio, già analizzato dal punto di vista dell’ ombreggiamento. Questo è situato nei pressi di Piazza Biondo Flavio, all’ incrocio di rilevanti assi stradali quali Via degli Orti di Cesare, Circonvallazione Gianicolense e Viale Trastevere. Presenta, come già riportato nella prima esercitazione, un orientamento che segue gli assi cardinali ma grazie all’ analisi della radiazione solare è stato possibile chiarire alcuni aspetti mai presi in considerazione fino ad ora, anche riguardanti gli spazi circostanti.
TUTORIAL:
Dopo aver modellato balconi e fineste nella volumetria dell' edificio, procediamo con l'analisi della radiazione solare.
STEP1: APERTURA SOLA RADIATION _ Selezionare ANALYZE nella barra dei comandi in alto a sinistra, poi cliccare su SOLAR RADIATION.
STEP 2: SELEZIONE DELLE FACCE _ In questa finestra appena comparsa selezionare la FRECCIA per poi andare a scegliere le masse/facce che si desidera analizzare.
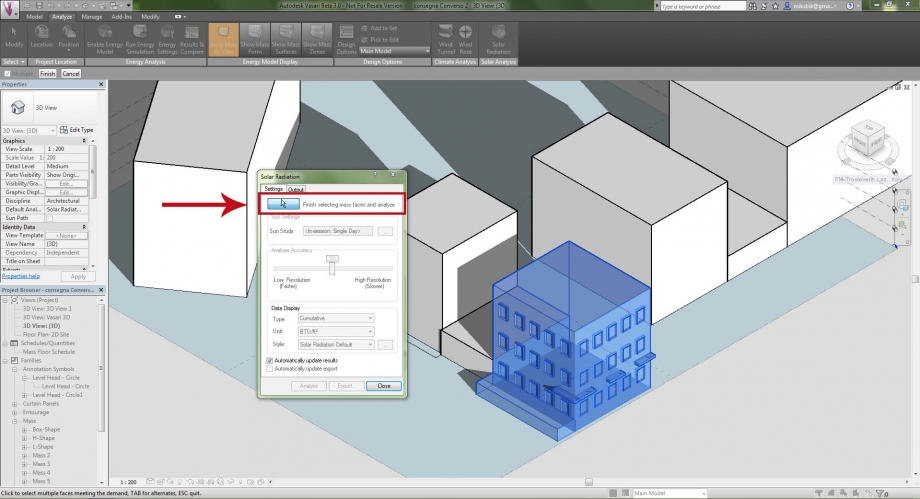
STEP 3: SUN SETTING _ Successivamente impostare l'intervallo di tempo o l'orario preciso in cui si vuole studiare l'edificio. Nel nostro caso abbiamo deciso di analizzarlo durante il solstizio d'estate, dall' alba al tramonto.

STEP 4: UNITA' E COLORI _ Il passo successivo consiste nello scegliere l'unità di misura, i kWh/mq. Inoltre è possibile selezionare i colori per caratterizzare le temperature massime e minime, nel nostro caso il blu è attribuito a quelle più alte mentre il giallo alle più basse.
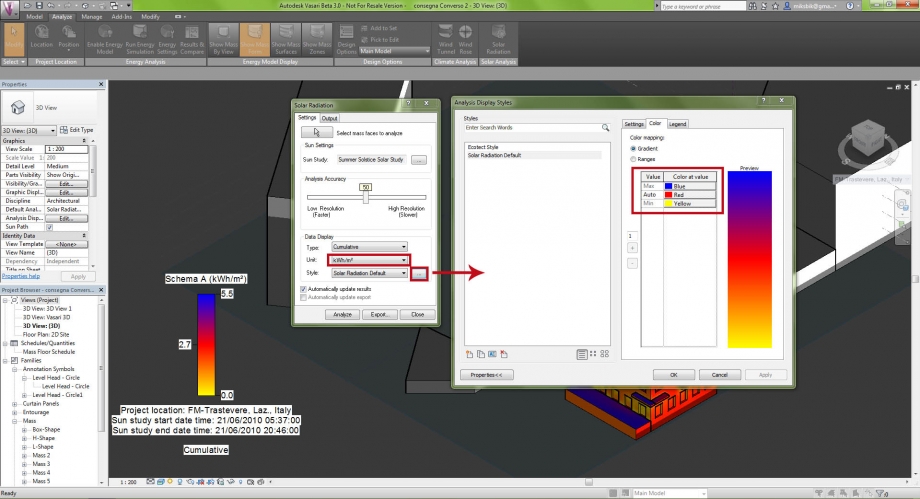
A questo punto possiamo procedere con l'analisi.
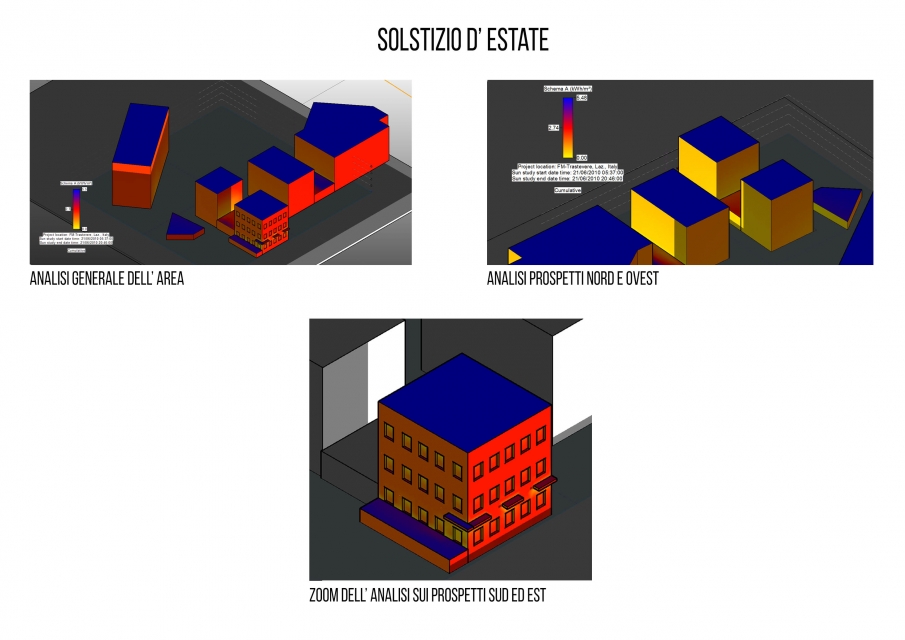 L’analisi del solstizio d’ estate, eseguita dall’ alba al tramonto, evidenzia che le facciate su strada (Sud ed Est) sono cariche di una radiazione solare che tende al limite massimo di calore. Ovviamente nel periodo estivo questo sovraccarico d’ irraggiamento rappresenta un fattore negativo, soprattutto perché a Roma la temperatura può arrivare a picchi di 30/35 gradi. Al contrario il prospetto a Nord rimane sempre in ombra ed è per tale motivo che risente decisamente meno di questo problema. Lo stesso accade per il prospetto ad Ovest, schermato in molte ore del giorno dagli edifici circostanti. Se ne deduce che gli ambienti più freschi in questo periodo dell’ anno sono sicuramente quelli a Nord-Ovest.
Altra nota non positiva che abbiamo riscontrato è la totale assenza di vegetazione intorno all’ edificato, essa infatti potrebbe essere un’ ottima barriera naturale per contrastare quest’ eccessiva radiazione solare.
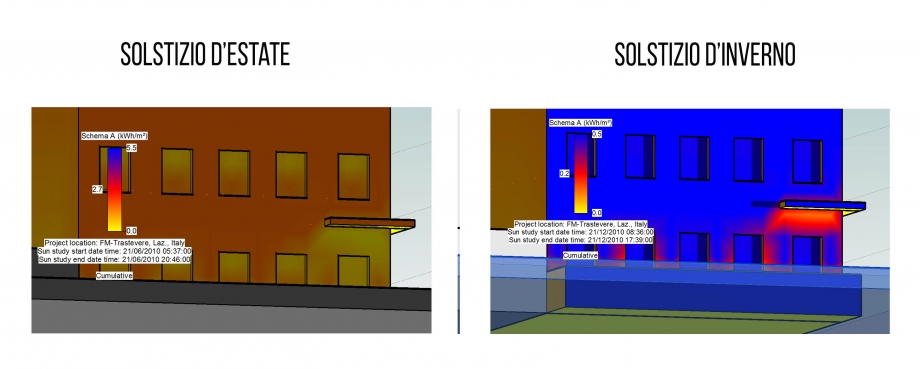
 Nel periodo invernale le facciate a Sud e ad Est sono ugualmente ben irraggiate, seppur la temperatura si mantiene ovviamente più bassa. Questo aspetto è più favorevole in questi mesi piuttosto che in quelli estivi in quanto le radiazioni solari contribuiscono in maniera passiva a migliorare il comfort termico degli ambienti interni dell‘ edificio.
Gli altri due prospetti, essendo meno colpiti dai raggi solari, hanno temperature nettamente più basse e quindi anche le stanze situate in queste parti della costruzione saranno le più fredde.
 Abbiamo analizzato anche l’impatto che la radiazione solare ha sul terreno. Si nota che il manto stradale che circonda l’edificio raggiunge le
temperature maggiori sia d’estate, con 5,5 kWh/mq , sia d’inverno, con 0,4 kWh/mq. Questa situazione rende le aree pavimentate intorno all’ edificio luoghi angusti in cui sostare nei periodi estivi ma zone più temperate in inverno. Inoltre si vede che nelle immediate aree a terra che circondano la costruzione la radiazione è più bassa, ciò favorisce la crescita di muffe o di macchie.
Lo stesso accade nei punti in facciata che si trovano al di sotto dei balconi. Questi ultimi, essendo in aggetto, generano delle ombre per la maggior del tempo e fanno si che la muratura rimanga spesso umida o bagnata, generando così macchie evidenti.
 -
-
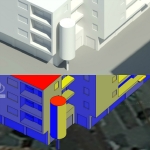
Tutto questo è evidente (oltre che dalla foto reale) anche da un altro stile di analisi ancora più preciso, quello numerico che indica il valore esatto dei kWh/mq nei punti presi in esame.

Come si nota anche da quest' analisi, la temperatura dimuisce al di sotto degli aggetti dei balconi.
Per creare questo nuovo stile bastano pochi e semplici passi:
STEP 1: Dopo aver selezionato SOLAR RADIATION nel menù ANALYZE, cliccare sui tre puntini della voce STYLE, attribuire un nome al nuovo stile e successivamente premere sull' icona in basso con il foglio bianco per poter impostare il tipo di analisi (MARKETS WITH TEXY) e ripetere il nome.

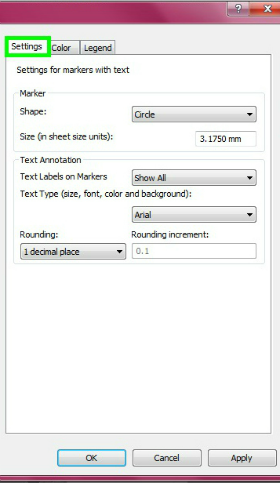
STEP 2: Selezionare SHOW ALL nell' area TEXT ANNOTATION ed impostare i decimali.
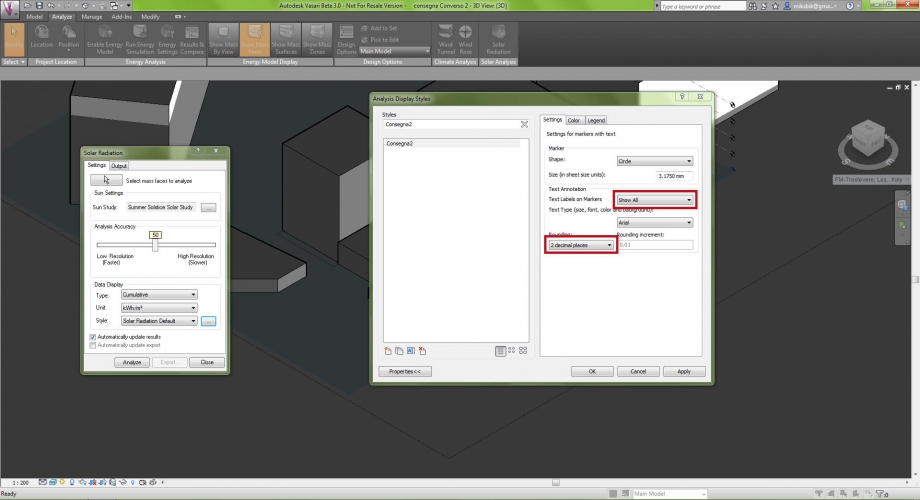
In questo modo avremo ottenuto il nostro stile per analizzare la radiazione solare.
2. ANALISI SOLARE DI PROGETTO
L'area di progetto è situata tra Viale Trastevere e Via Degli Orti di Cesare, è un lotto a forma triangolare e presenta un dislivello di circa sei metri da prendere in considerazione per la struttura e per gli accessi all' edificio. Nel nostro progetto sono previste due diverse entrate (probabilmente diventeranno tre), una su Viale di Trastevere ed un' altra ad una quota più bassa sulla piccola via laterale che andremo a riqualificare allargando la sezione. Vista la posizione dell' area, l' edificio assumerà una notevole importanza e rappresenterà un punto focale fondamentale per chiunque provenga da Circonvallazione Gianicolense o esca dalla Stazione di Trastevere.
Il nostro progetto prevede la realizzazione di un unico edificio con due facciate principali su Viale di Trastevere (una delle quali in continuità con lo stabile adiacente) e con una grande apertura centrale che permette di sfruttare gran parte del lotto per creare una nuova zona di condivisione sociale. Sono previste varie attività e diversi servizi ed è nostra intenzione mantenere inoltre spazi aperti in cui poter sostare liberamente. Per questo motivo è essenziale che il lotto rimanga in luce il più possibile durante l' inverno ed abbastanza in ombra d'estate. Stiamo valutando anche l'ipotesi di modificare le altezze dei vari blocchi dell' edificio per favorire l'irraggiamento sia dei locali interni che degli spazi esterni.

Dopo aver creato i volumi della planimetria abbiamo inserito il nostro edificio nel contesto per poter studiare l'irraggiamento dei diversi prospetti ed abbiamo scelto due diverse viste: una a Sud-Ovest che ci consente anche di capire l'ombreggiamento sull' asse principale di Viale di Trastevere ed una a Nord-Est per analizzare la situazione nella parte restrostante della costruzione, quella che ospiterà spazi aperti e comuni.
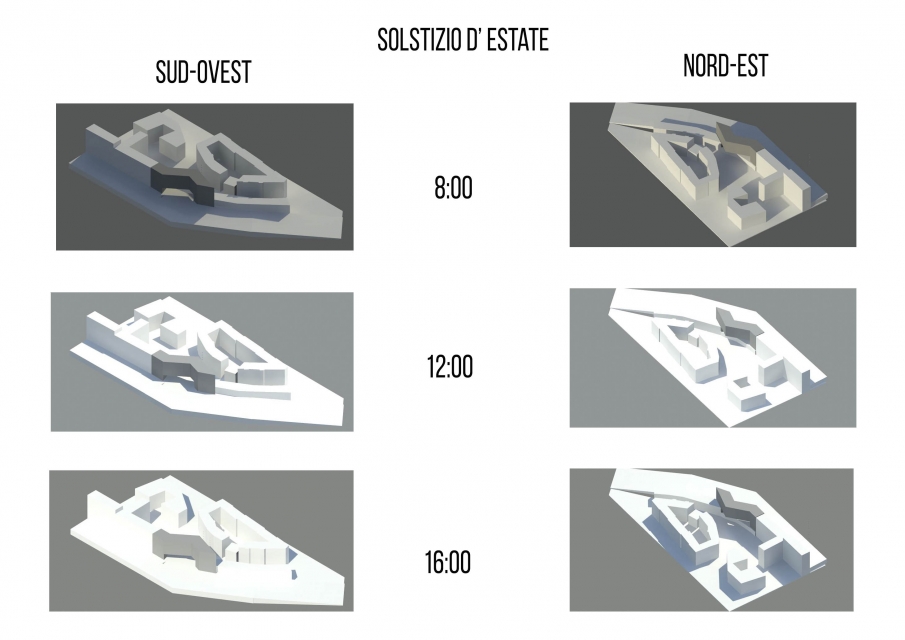
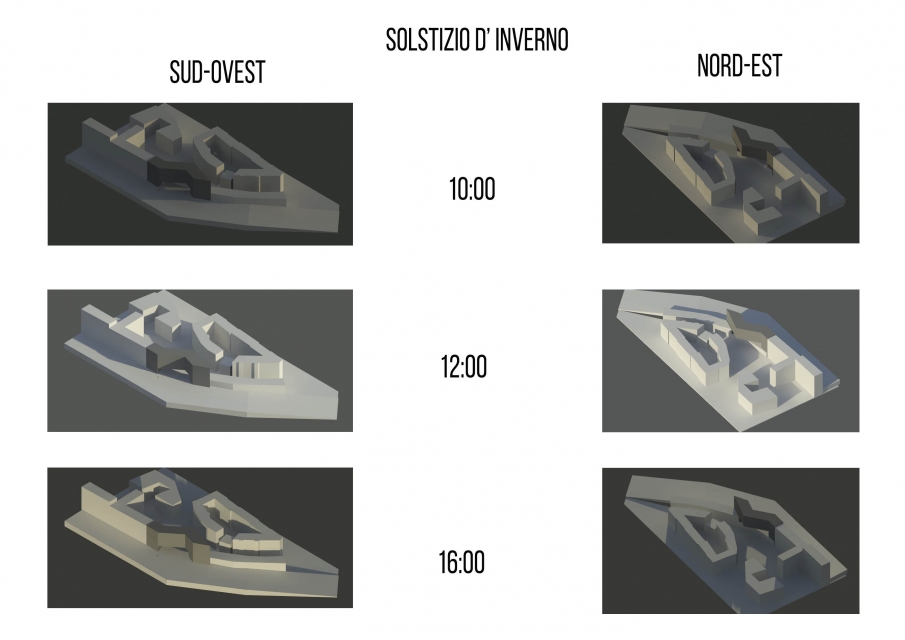 Analizzando la situazione sia durante il periodo estivo che durante quello invernale abbiamo notato che l'orientamento dell' edificio è abbastanza buono in quanto riceve luce sia da Est che da Ovest (e ovviamente anche da Sud) durante tutto l'anno.
Sia d' estate che d' inverno i prospetti a Sud-Ovest prendono luce maggiore nel pomeriggio, al contrario quelli a Nord-Est godono dell' irraggiamento solare durante la mattinata. Non ci sono facciate che restano perennemente in ombra e ciò ci permette di confermare la nostra idea di distribuzione delle residenze interne: corridoi centrali e alloggi laterali, sia a Est che ad Ovest. Questa sistemazione risulta essere ottimale, sia per la sezione della costruzione sia per l'illuminazione come si evince da questo studio. Inoltre risulta che gli spazi aperti, sia sul fronte principale dell' edificio sia nella parte retrostante, ricevono abbastanza luce d'inverno e la giusta ombra d'estate. In questo modo gli utenti possono sfruttarli al massimo e si può iniziare a pensare di inserire del verde.
Tutto l'aspetto dell' irraggiamento potrebbe essere ottimizzato riducendo l' altezza del blocco a Sud, in modo tale da garantire maggior respiro e maggior illuminazione alle restanti parti e agli spazi aperti del piano terra. Ci proponiamo di riflettere su questa possibile modifica.
Dopo aver concluso tale analisi abbiamo valutato le dimensioni dei blocchi che compongono il volume di progetto grazie ad un prezioso strumento che Vasari mette a disposizione: la Schedule.
STEP 1: IMPOSTAZIONE DEI LIVELLI _ Prima di iniziare a creare la schedule è essenziale impostare i livelli per lavorare sui diversi piani dell' edificio modificando le quote e se necesssario i nomi.
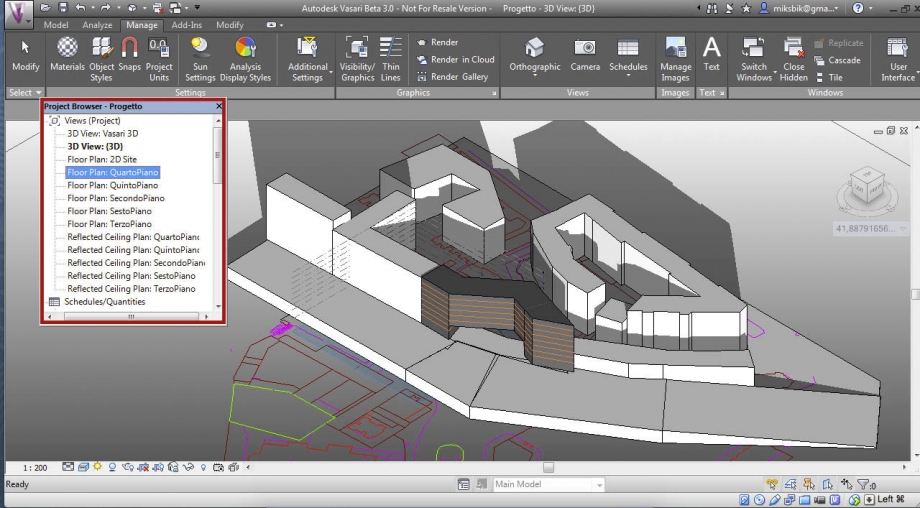
STEP 2: DENOMINAZIONE MASSE E AVVIO SCHEDULE _ Prima di iniziare a creare la schedule, altro passaggio fondamentale è quello che consiste nel rinominare le masse che compongono la volumetria. Dalla finestra del PROJECT BROWSER basta cliccare con il pulsante destro del mouse sul nome della massa interessata e procedere selezionando RENAME. Dopodichè premere MANAGE nella barra dei comandi in alto e cliccare su SCHEDULE/QUANTITIES.
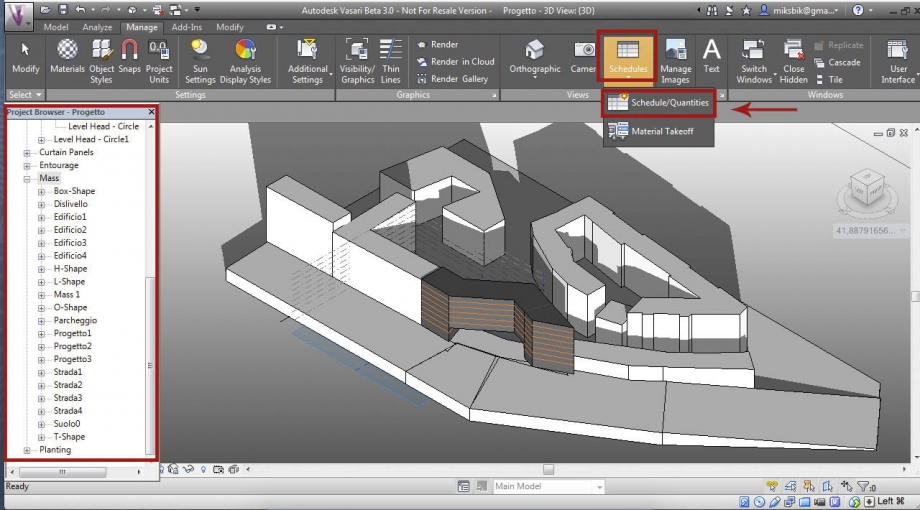
STEP 3: CATEGORIA DELLA SCHEDULE _ Una volta che si aprirà questa finestra, selezionare la categoria della schedule che si desidera creare ed inserire un nome.
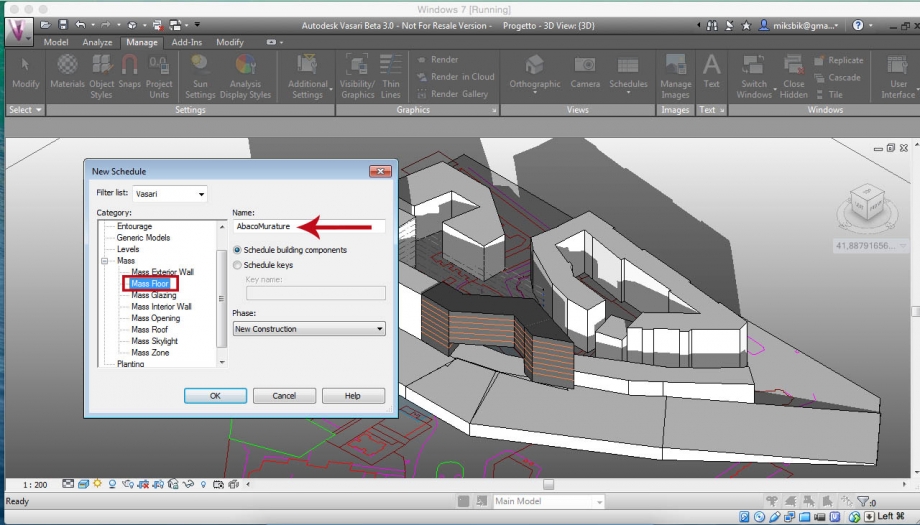
STEP 4: PROPRIETA' DELLA SCHEDULE _ A questo punto è necessario scegliere i campi dell' edificio che si desiderano analizzare. Selezionarne uno ad uno ed ogni volta premere ADD.
STEP 5: SCHEDULE _ Infine apparirà la schedule completa con indicati i vari campi d'indagine, nel nostro caso aree, perimetri e volumi delle tre masse che compongono l'edificio di progetto.
 alice.speziale
Gio, 23/04/2015 - 19:59
alice.speziale
Gio, 23/04/2015 - 19:59
In questa prima parte della seconda esercitazione, l'obbiettivo è quello di analizzare l'effetto delle radiazioni solari sull'edificio studiato nella prima esercitazione.
STEP 1.
MODELLAZIONE: Prima di tutto dobbiamo andare a caratterizzare il nostro edificio con gli elementi che lo compongono e che ne influenzano il comportamento rispetto alla quantità di calore ricevuta. Nel nostro caso sono presenti degli elementi relativamente aggettanti come i cornicioni, le bucature delle finestre profonde 30 cm e gli avancorpi dei corpi scala. Copre un ruolo di fondamentale importanza la vegetazione presente nel cortile, che mitiga l'irraggiamento proveniente da sud, e rende questo luogo comune piacevole e fresco durante l'estate. Sono presenti palme da datteri (Phoenix dactylifera) e un grande Pinus nigra che raggiunge i 20 metri di altezza.
Per poter lavorare sulla massa creata precedentemente per l'analisi dell'ombreggiamento, bisogna selezionarla e cliccare su (a) EDIT IN-PLACE, dopodichè, scelto il piano di lavoro (SET), a seconda delle esigenze usare i comandi SOLID FORM e VOID FORM per creare gli elementi necessari per l'analisi delle radiazioni.
(a) 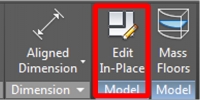 (b)
(b) 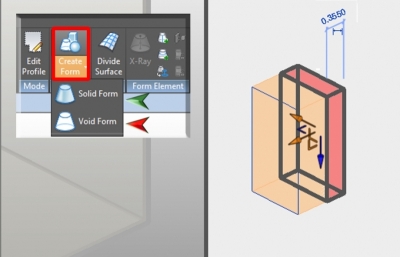
DOWNLOAD: Completata la massa con aggetti e bucature e disposta la vegetazione presente nel cortile si può procedere il download dell'applicazione aggiuntiva di Vasari SOLAR RADIATION che ci permetterà di effettuare l'analisi dell'irraggiamento.
STEP 2.
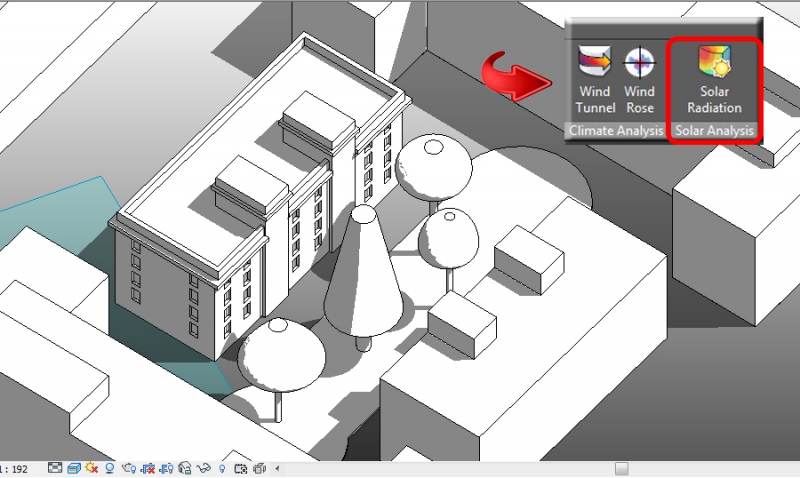
ANALISI COMPLESSIVA: il comando si trova nel menù ANALYSIS, cliccare su SOLAR RADIATION.
Si aprirà un menù con varie opzioni da settare:
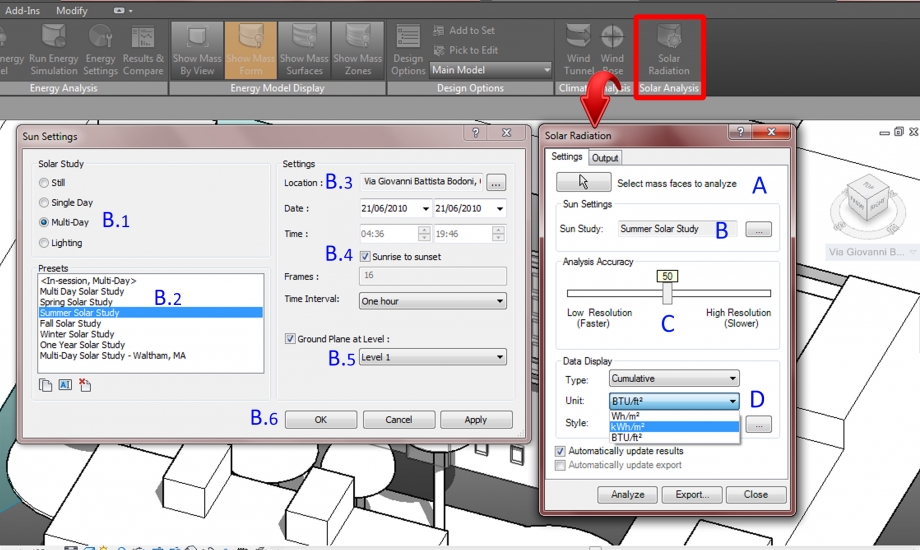
A. "select mass faces to analyze" ci permette di scegliere le facce del solido da sottoporre all'analisi.
B. cliccando sui puntini che affiancano il comando "sun study" si aprirà una finestra di comando "sun setting" che consente di decidere il lasso temporale durante qui verrà effettuata l'analisi:
B.1 : Scegliere "multy-Day"
B.2 : A seconda delle esigenze scegliere la stagione. Nel nostro caso analizzeremo il comportamento delle radiazioni durante l'estate e l'inverno.
B.3 Controllare che la "location" sia effettivamente quella giusta.
B.4 Per effettuare un'analisi dall'alba al tramonto cliccalre su "sunrise to sunset".
B.5 Selezionare il "ground plane" corretto.
B.6 Dare OK e tornare alla finestra "Solar Radiation".
C. La barra "analysis accuracy" permette di aumentare o diminuire la risoluzione e la precisione dell'analisi.
D. Cambiare l'unità di misura da BTU/ft^ a kWh/m2. .
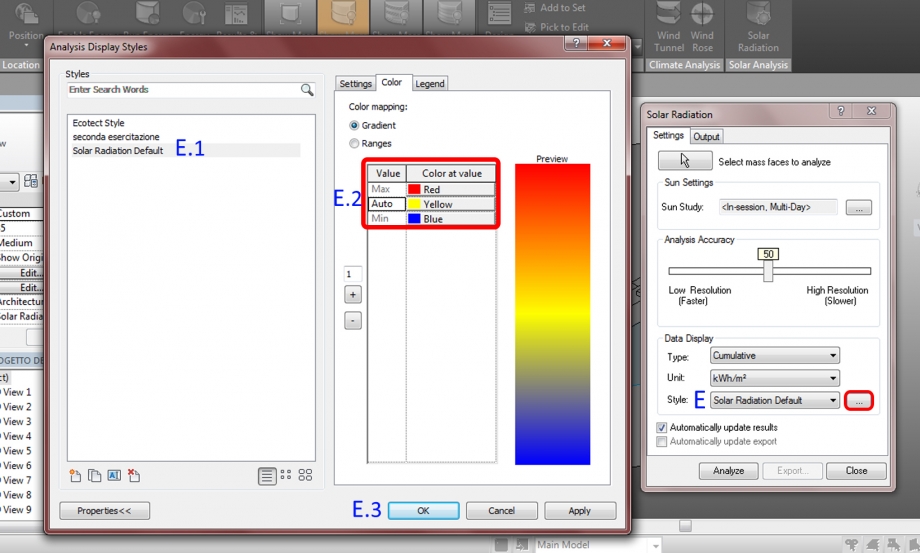
E. Per modificare lo stile di analisi cliccare sui puntini che affiancano il comando "style";
E.1 Scegliere "Solar Radation Default" come stile di analisi.
E.2 Settare i colori opportunamente. Noi abbiamo scelto il rosso per il valore max, giallo per quello medio e blu per quello minimo.
E.3 Dare Ok per salvare le modifiche.
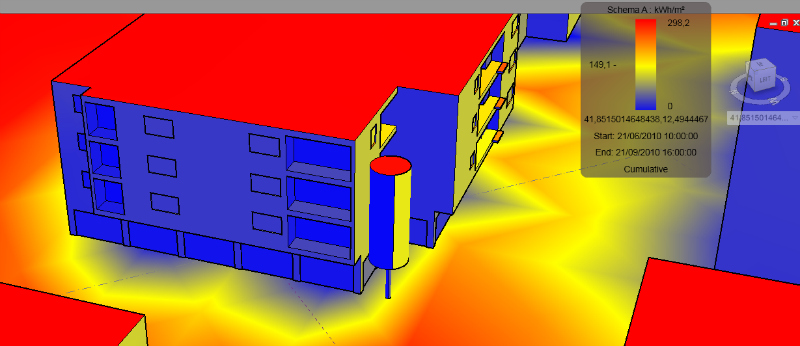
In questa prima analisi complessiva, in base all'orientamento e al periodo dell'anno, vengono visualizzate e quantificate le radiazioni solari incidenti sulle superfici dell'edificio e relativo conteso. Le radiazioni sono onde elettromagnetiche emanate dal sole attraverso l'irraggiamento, ossia energia per unità di area kWh/m2..
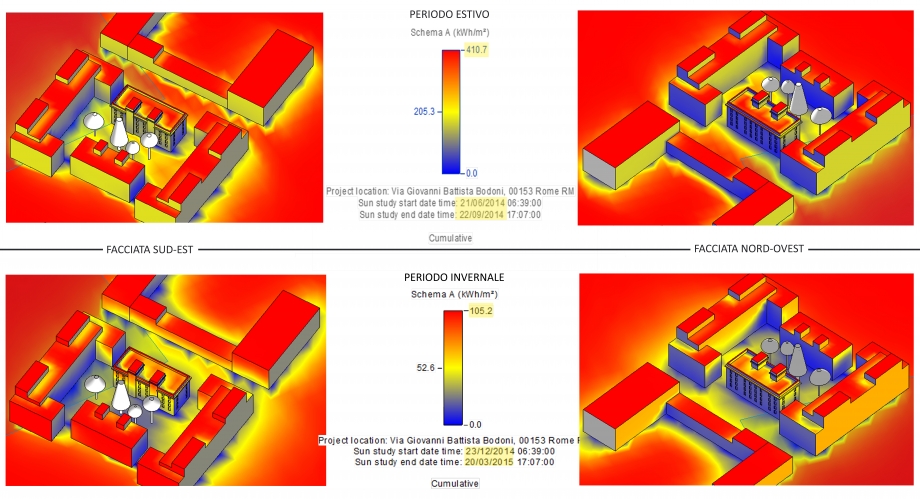
I periodi scelti per effettuare l'analisi dell'irraggiamento sono il periodo estivo, dal 21 giugno 2014 al 22 ottobre 2014, e quello invernale dal 23 dicembre 2014 al 20 marzo 2015. Non ci è sembrato opportuno analizzarlo nelle altre stagioni (autunno e primavera) in quanto non mostravano cambiamenti significativi rispetto ai periodi estremi.
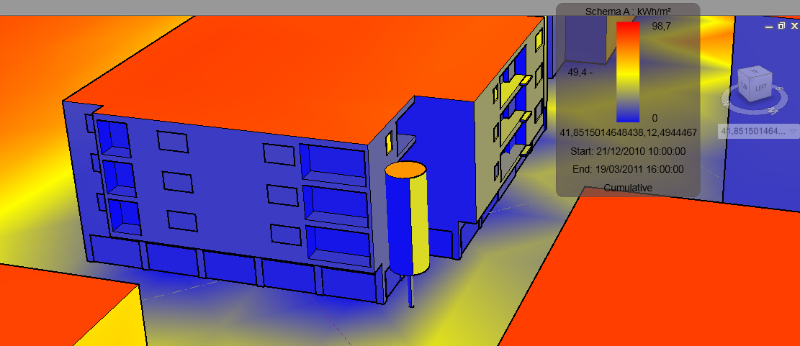
Quello che si può notare nel periodo estivo è il valore dell'irraggiamento della facciata SUD-EST dell'edificio, intorno ai 150 kWh/m2, e confrontarlo con i 410 kWh/m2 del valore massimo. Risulta evidente l'importanza della vegetazione nel cortile che filtra le radiazioni solari rendendo la facciata meno esposta/calda sia in estate che in inverno; Nel periodo invernale, quando il percorso del sole è più basso e le radiazioni oltre che a essere ostacolate dall'edificio contrapposto sono filtrate dalla vegetazione (sempreverde) la facciata risulta umida soprattutto ai piani inferiori. Risultano sfavorevoli le altre tre facciate NORD-OVEST, SUD-OVEST, NORD-EST come già si era osservato dalle analisi dell'ombreggiamento. La meno luminosa è naturalmente quella NORD-EST, mentre in quella opposta seppur illuminata vi è una disparità tra i piani inferiori e superiori. Per quanto riguarda la facciata NORD-OVEST rimane fredda sia in estate che in inverno, ma ciò non si percepisce dall'interno dell'alloggio privato, in quanto la presenza di un edificio basso opposto rispetto ad esso fa percepire un'illuminazione piacevole e diffusa.
ANALISI DEGLI SPAZI COMUNI
Il cortile del complesso condominiale rappresenta un luogo fondamentale per l'aggregazione sociale, dai bambini che giocano agli anziani che passano le loro giornate; per questo motivo abbiamo deciso di analizzare l'irraggiamento nelle diverse stagioni dell'anno per capire se è effettivamente un luogo piacevole e confortevole. Prima di procede con la verifica abbiamo aggiunto un colore alla scala per conferire più precisione all'analisi:
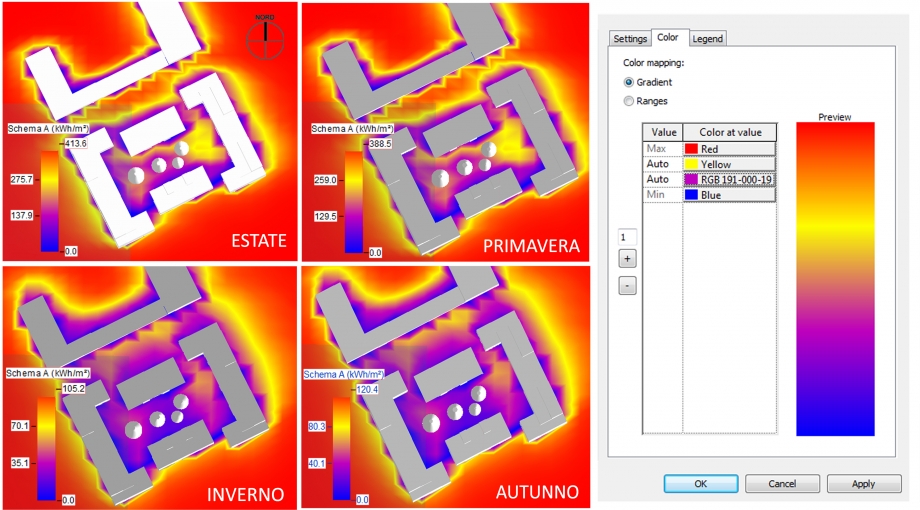
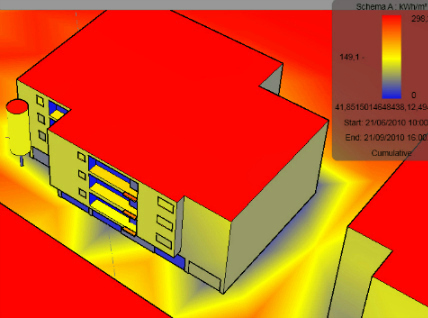
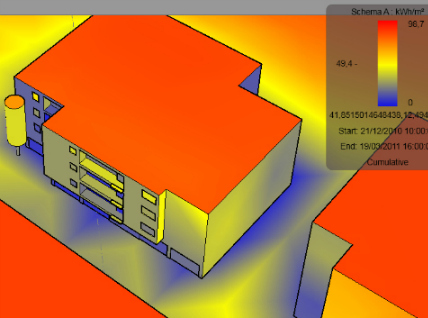
Considerazioni: nel periodo estivo e primaverile è chiaro come il cortile, favorito dalla presenza degli alberi, presenti una situazione positiva rispetto ai valori massimi 412 kWh/m2 e 388 kWh/m2 , soprattutto nella parte sud-ovest dove i valori si aggirano intorno ai 130 kWh/m2 . La differenza è notevole se si confronta con le forti radiazioni solari in via Giovanni Battista Bodoni. Si può notare anche come gli spazi di collegamento tra l'esterno e l'interno del cortile siano soggetti a pochissimo irraggiamento, durante tutto l'anno, ma ciò non sfavorisce la vita nel cortile in quanto la maggior parte delle attività si svolgono al centro. Durante il periodo invernale e autunnale la sitauzione cambia radicalmente, il cortile diventa uno spazio umido e freddo in cui il valore più alto si aggira tra i 30 e 50 kWh/m2.
In generale quindi si può considerare il cortile uno spazio confortevole durante i periodi di maggiore attività sociale (estate e primavera) , mentre non del tutto inospitale durante i periodi freddi (inverno e autunno).
STEP 3.
Come effettuare una ANALISI NUMERICA :
come nel secondo step aprire la finestra "Solar Radiation"
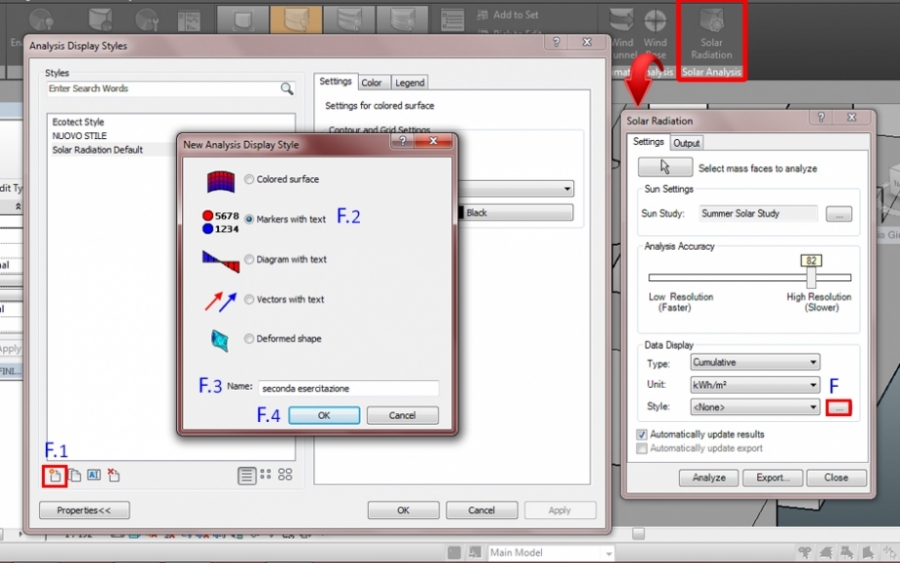
F. Selezionare ia casella accanto allo stile di analisi; apparirà la solita finestra "Analysis Display Styles".
F.1 Cliccare sull'icona "nuovo stile"
F.2 Selezionare il tipo di analisi, nel nostro caso "Makers with text" che ci permetterà di visualizzare i dati numerici.
F.3 Scegliere il nome del nuovo stile (seconda esercitazione)
F.4 Dare "ok" per salvare le modifiche.
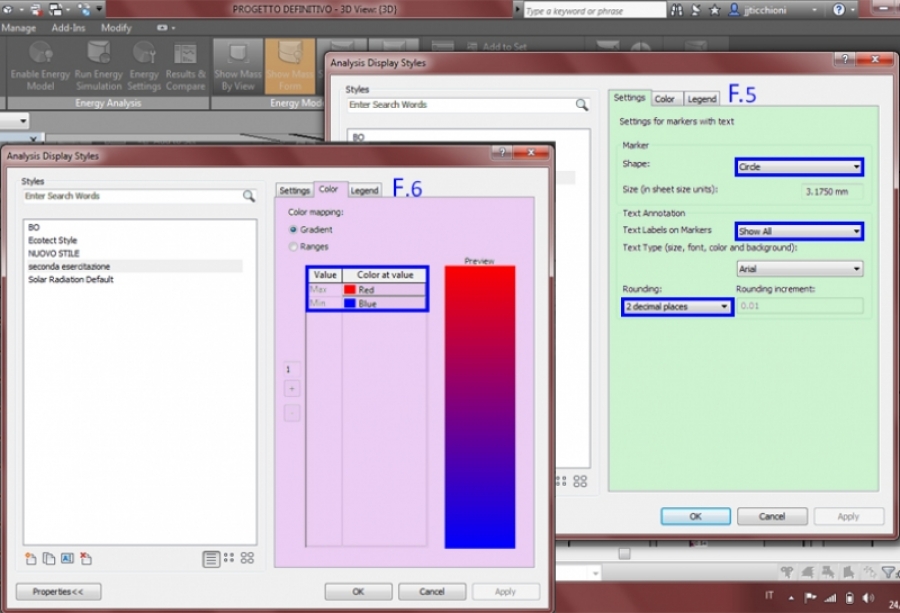
Dopodichè settiamo lo stile selezionato in base alle nostre esigenze:
F.5 Nella pagina "setting" controllare che lo "Shape" sia circolare;
selezionare "Show All" per le annotazioni testuali;
selezionare "2 decimal places"
F.6 Nella pagina "color" scegliamo il rosso per il valore max e il blu per il valore min.
STEP 4.
STUDIO DELLE FACCIATE E DELLE SUPERIFICI VETRATE
Dopo aver fatto delle considerazioni sugli aspetti generali dell'edificio e del suo contesto scendiamo di scala e ci soffermiamo sulle singole facciate e le rispettive bucature. In particolare verranno analizzate la facciata SUD-EST e quella SUD-OVEST sia in estate che in inverno.
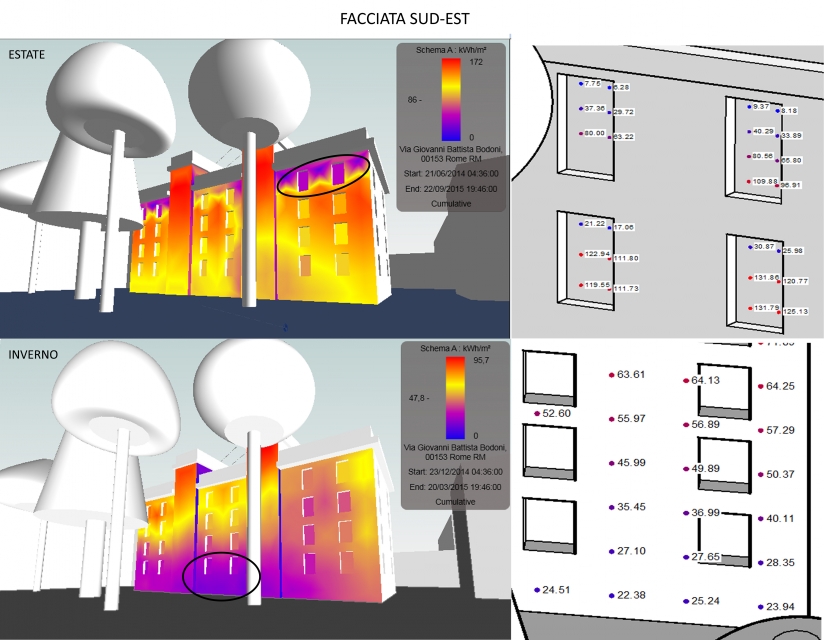
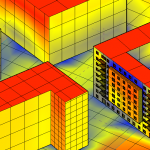
Ciò che appare evidente dai colori dell'analisi è che nel periodo estivo l'ultimo piano (corrispondente all'appartamento preso in esame) risulta poco irraggiato, infatti si trova in prossimità dei cornicioni (che aggettano di circa 35/40 cm) creando una forte differenza rispetto a quelli più bassi. La situazione viene confermata dai valori risultati dall'analisi numerica che decrescono dal basso verso l'alto arrivando al valore minimo di 7.75 kWh/m2. rispetto a quello max del piano inferiore di 120 kWh/m2.
In inverno la situazione risulta opposta a quella in estate, la parte che riceve meno luce e calore è quella in prossimità dell'attacco a terra. Anche qui i valori ce lo confermano, partendo dal basso i valori aumentano, da 22/25 kWh/m2 a 45/50 kWh/m2.
Un ulteriore verifica di questi dati è il confronto diretto con la superficie dell'edificio e di eventuali segni di degrado dovuti all'insufficiente irraggiamento solare. Nella prima foto si nota come in generale l'edificio sia caratterizzato da macchie di umidità, le altre due riguardano il piano terra e l'attacco a terra che sono visivamente compromessi dall'umidità, più che in altri punti della facciata.
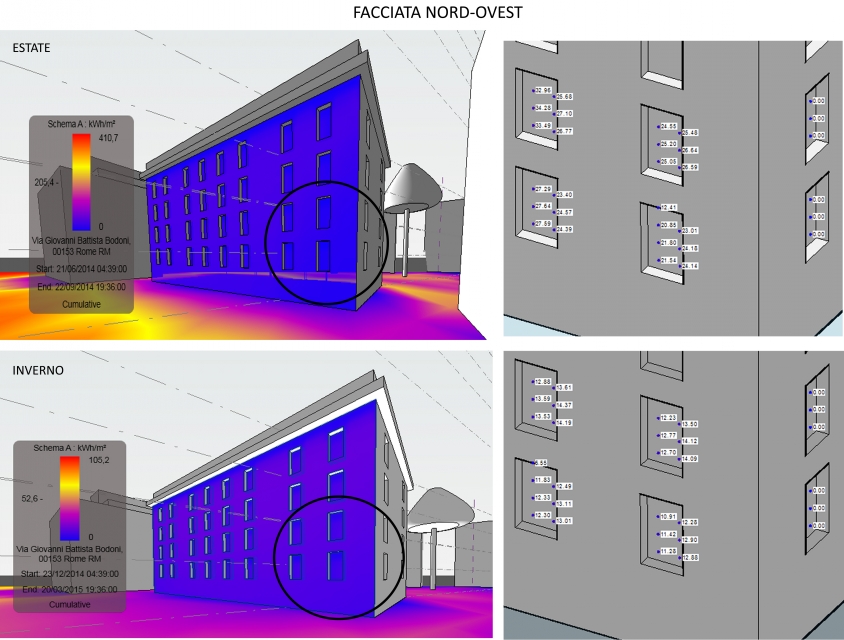
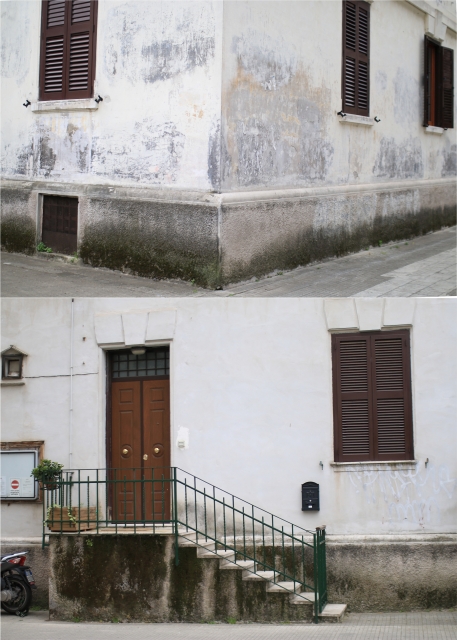
Dall'analisi della facciata esposta a NORD-OVEST la superficie appare insufficentemente irraggiata sia in estate che in inverno, ma più uniforme tra i vari piani, rispetto a quella esposta a sud-est. Questa uniformità si evince anche dai dati numerici che non aumentano in modo considerevole, infatti partendo dalla finestra dal piano terra e arrivando a quella del primo piano i valori aumentano da 21/24 Kwh/m2 a 25/32 kWh/m2 in estate e da 11/12 kWh/m2 a 12/13 kWh/m2 in inverno. Va considerata in parte anche la facciata SUD-OVEST che data la sua vicinanza all'edificio accanto non risulta affatto irraggiata, dove il valore è 0.00 kWh/m2. Infine, il confronto tra i dati e la situazione attuale delle superfici dell'edificio è testimoniato dal loro deterioramento. La prima foto mostra l'attacco a terra di entrambe le facciate, la seconda le scale che portano all'edificio che si trova accanto a quello preso in esame.
ANALISI DELL' OMBREGGIAMENTO IN VIA ASLAGO, BOLZANO
Nella seconda parte dell'esercitazione verrà effettuato uno studio dell'ombreggiamento riguardante il lotto assegnatoci per progettazione in via Aslago, a Bolzano. Dopo aver verificato l'attendibilità del programma nella prima esercitazione possiamo procedere con una accurata analisi
Gio, 23/04/2015 - 20:57
 Vincenzo Panasiti
Gio, 23/04/2015 - 18:46
Vincenzo Panasiti
Gio, 23/04/2015 - 18:46
Buonasera ragazzi,
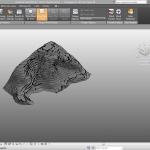
come regalo preconsegna, abbiamo realizzato in Vasari la montagna per il Lab. del Prof. Vidotto.
https://drive.google.com/file/d/0B5PakAfZS2FEVjNCU2FGM2xfTmc/view?usp=sharing
La montagna è a tutti gli effetti una massa, quindi potete importarla all'interno del vostro progetto.
Alcune raccomandazioni:
1- La scala è giusta ma andrà orientata corettamente.
2- Usate un computer potente!
Buon lavoro con la consegna
Gio, 23/04/2015 - 18:52
 Folgiero_Guratti
Gio, 23/04/2015 - 17:04
Folgiero_Guratti
Gio, 23/04/2015 - 17:04
VIA BORGHESANO LUCCHESE_Marconi – Es. 2 Analysis Solar Radiation.
In order to analyze the solar radiation on the building studied in the first exercise, we have to continue modeling through the definition of particulars on the facade: adding windows and balconies, we can better define the shape and the behaviour of the building during the day.
STEP 1: Select the mass on which you want to add particulars.

STEP 2: Select MODIFY > EDIT IN PLACE to be able to modify the existing mass.

STEP 3: Select WORK PLANE > SET to choose the facade on which you want to draw your window. Then, use the drawing tools to define the shape and the measure of the window. While drawing, you have to pay attention to the work plane on which you are working.

STEP 4: Now that you have drawn the window shape, to create the void of the window you have to use the command “Void Form”
MODIFY > CREATE FORM > VOID FORM


In our case, the building presents also balconies, so we have to draw them.
The process to draw the shape of the balcony is the same, but, when you have to create the solid, you have to click on
MODIFY > CREATE FORM > SOLID FORM


STEP 5: To complete the modeling, click on FINISH MASS

Repeat the process and draw all your windows and balconies. Remember to draw the ground floor: it will be useful for the analysis of solar radiation.

ANALYSIS SOLAR RADIATION
When your modeling is finished, you can start the analysis of solar radiation.
To start the analysis, you have to select
ANALYZE > SOLAR RADIATION
Then, select the faces you want to analyze and select the unit kWh/mq. Bring the accuracy to 100 and modify the "Sun Study" and the "Style:

1) Sun Study: Select the range of the analysis (single day or multi day) and the period (Winter Solar Study and then Summer Solar Study). Remember to tick the option "Sunrise to Sunset".

2) Style: check the colors, because blue has to indicate the lowest temperature and red the highest one. You can use Yellow to indicate a middle temperature.

Finally, you can Analyze your selected faces. Otherwise, you can analyze all masses without choosing any facade and simply clicking on "analyze". A window will appear on yur display, and all you have to do is to choice the option "Analyze all mass faces in view":

Summer Solar Study:

 Even if the analyzed facade is exposed toward Sud, on the Summer Solstice it results being less radiated than on the winter one. Infact the hottest surface is the on on the top and in general all the orizontal planes; for example from this photo we can see that the yellow color is localized on the cover and on the balconies floor. Moreover, the coolest zones are the one near the overhangs.

Winter Solar Study:

 Contrary to what we are used to think the facade results being more healed during the winter because the solar rays bump it perpendicularly. The shadows of the near buildings are useful to optimize the surface temperature.

You can analyze the solar radiation in a different way, through numbers. We used this method to analyze windows:
1) Create a new style, select "markers with text" and name it.

2) From "Settings" you can modify the shape and the size of the marker. Check again the colors, in order to indicate the highest temperature with Red and the lowest one with blue.

3) Select the "One Year Solar Study" Sun Study and analyze. Remember to choose the style you created.

OUR PROJECT IN BOLZANO
The site of our project presents some problems, mostly caused because of the mountain Kohler: the sun doesn't reach the site until 11.20 am.
For this reason, it is important to consider this phenomenon in the analysis of shadows.

This image gives an idea of the mountain's dimension compared to the site and shows up the situation at 12.00 am on 10th January, when the sun reaches the whole area.
In order to better analyze shadows during the day, we observed our site at different hours and days of the year (red buildings are the components of our project).
1) at 11.20 am on 10th January, the sun begins to appear behind the mountain:

2) h.11.30 - 10th January:

3) h.12.00 - 10th January: The sun light covers entirely our open space.

4) h.15.00 - 10th January:

We also analyzed the sun on 21st June, to verify differences between winter and summer:
1) On 21st June, at 6.00 am the sun is already reaching most of our site:

2) So, we wanted to see what happens at 11.20 a.m in summer, since during the winter the sun appears at that time, while during the summer the sun appears earlier.
h.11.20 - 21st June:

3) h. 15.00 - 21st June:

4) h.18.00 - 21st June:

Our plan disposition is due to the willingness of having buildings that don't create shadows the one on the other and at the same time of forming an homogeneous courtyard. Collocating the longest block on via Aslago we wanted to allow the facade to receive the sud-east sun light as soon as possibile on January since the mountain avoids the site having a good insolation. So we observe that the courtyard is shady only for Acts of God (the mountain), but at 6 a.m on June it's already sunny which is likely to the old people. At 12 a.m on January most of the buildings's surface is reached by the sun, which is good to fight the low temperature.
Finally, we prepared a schedule, "Abaco delle metrature", which indicates our four buildings and their dimensions: perimeter, area, volume.
