


 laura.vellucci
Mar, 06/01/2015 - 18:56
laura.vellucci
Mar, 06/01/2015 - 18:56
Double Curtain Wall
A tiny house
 silvia giachetti
Mar, 06/01/2015 - 13:48
silvia giachetti
Mar, 06/01/2015 - 13:48
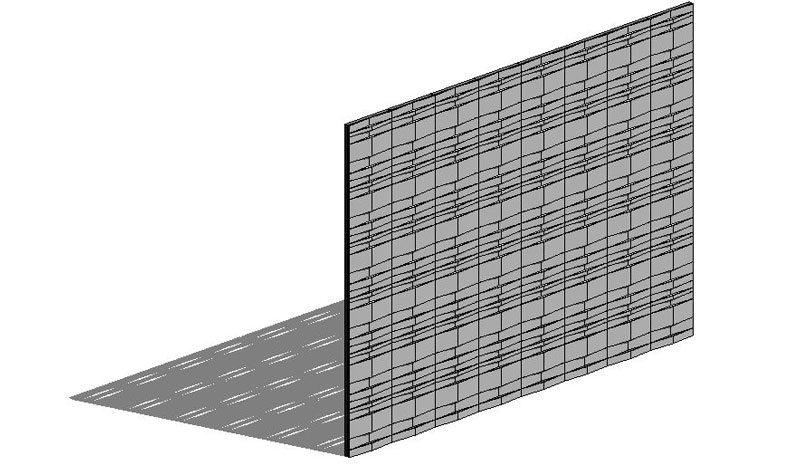
Ciao a tutti, per questa consegna ci è stato richiesto di modellare un pannello per una facciata e di inserirlo in un sistema di involucro con l'ausilio di una griglia.
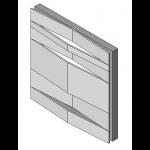
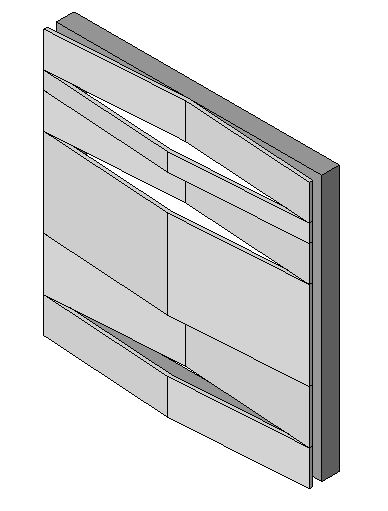
Ho pensato di proporre un pannello composto da lamine di alluminio piegate di diversa altezza e sfalzate tra loro, per cui la famiglia pannello sarà una famiglia nidificata.
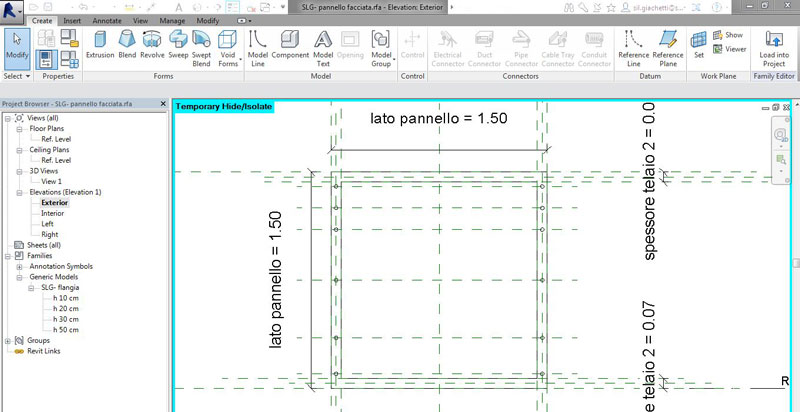
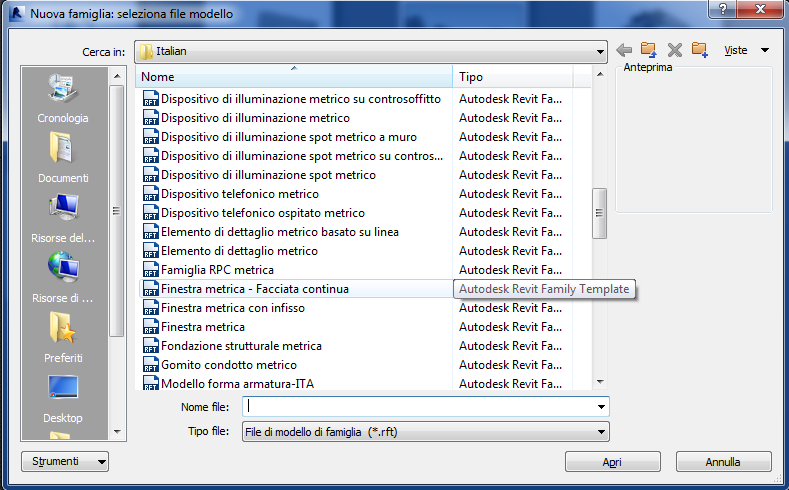
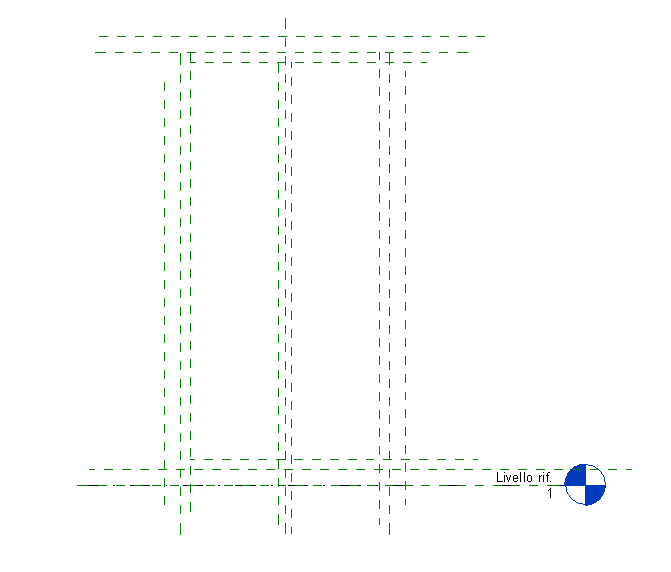
Per modellare il pannello ho aperto una new family>metric curtain wall panel.
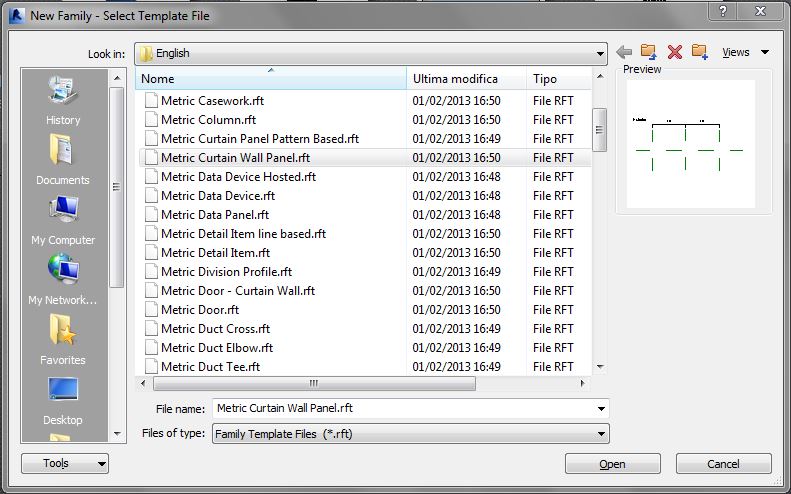
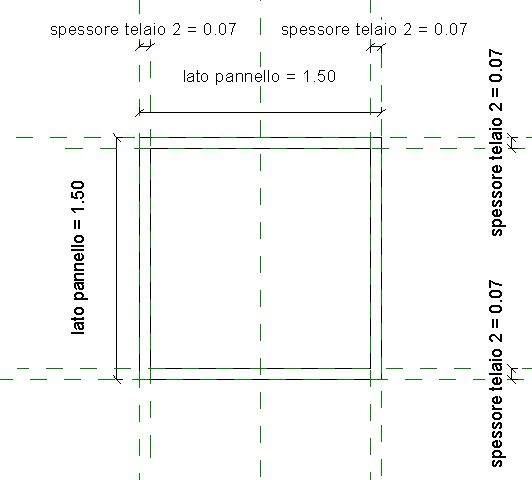
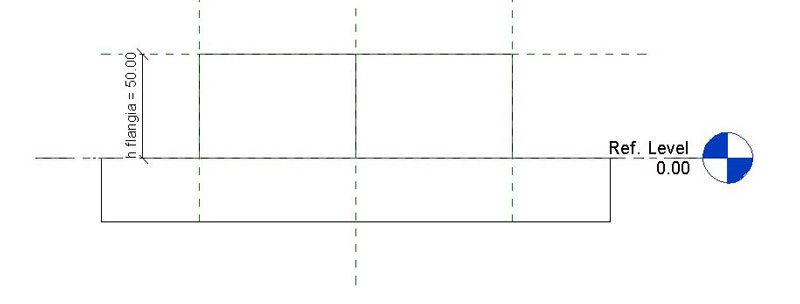
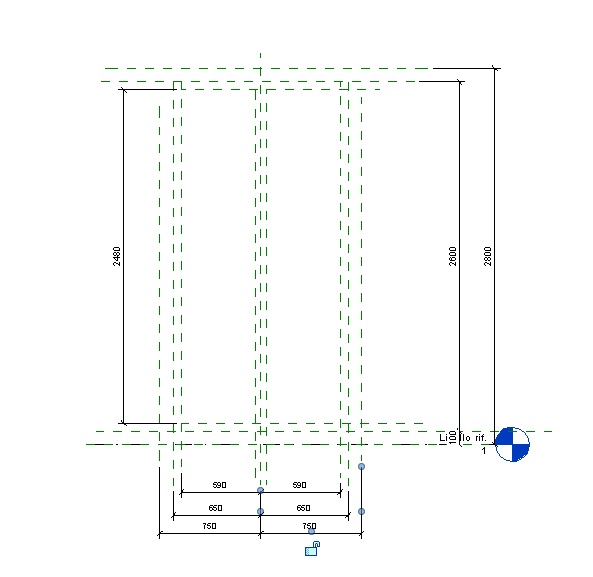
Questo template dà di default dei piani di riferimento e indica inoltre la posizione interna e esterna in cui poniamo il pannello. Ho quindi tracciato delle quote lineari e ho assegnato loro dei parametri dimensionali prima di eseguire l'estrusione. Successivamente ho impostato il telaio del pannello disegnando il primo solido con il comando Create>Extrusion>Rectangular che poi ho "scavato" con il comando Create>Void Extrusion>Rectangular.
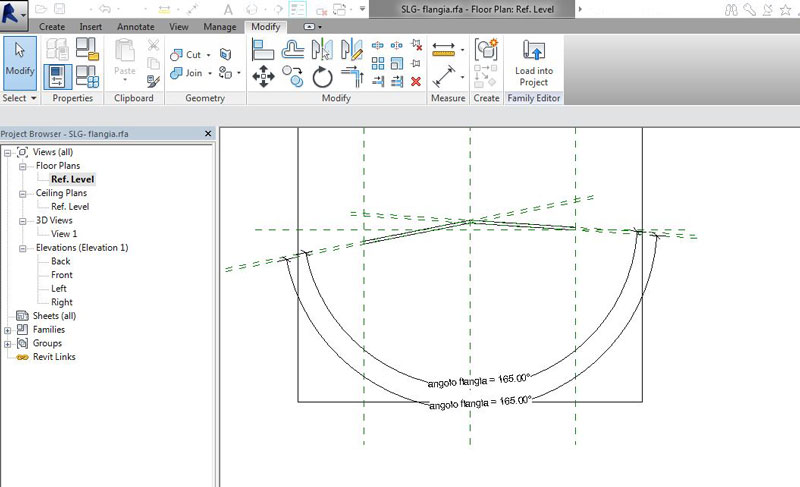
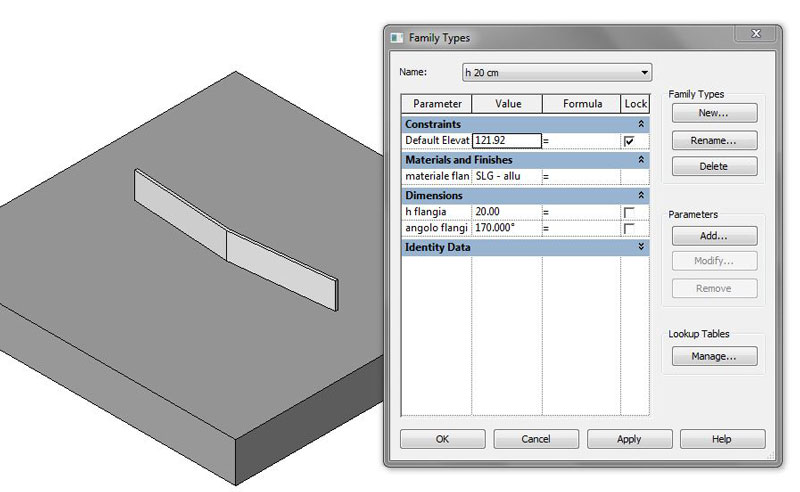
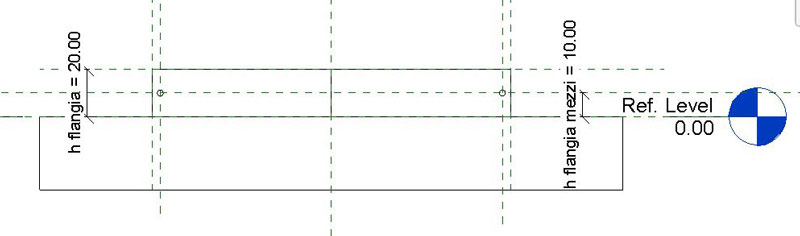
Per le lamine di alluminio ho aperto new family>metric generic model face based, ho tracciato i piani di riferimento e ho tracciato l'estrusione dalla vista Ref.Level con il comando create>extrusion>line. Nella stessa vista ho poi tracciato delle quote angolari a cui ho assegnato dei parametri, mentre ho parametrizzato nella vista Front l'altezza della lamina.
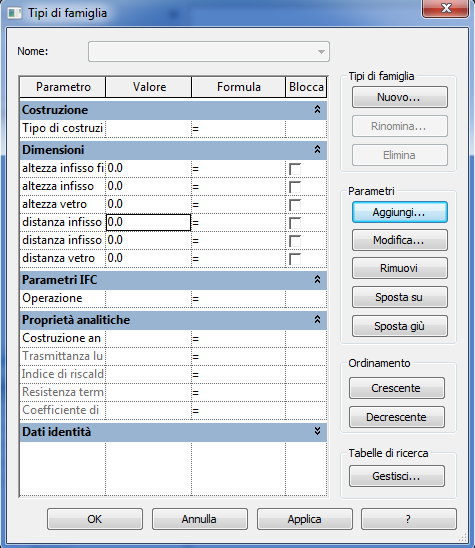
Ho quindi assegnato il parametro materiale e definito 2 tipologie di lamina diverse per altezza (10 cm, 20 cm, 30 cm, 50 cm).
Ho salvato la famiglia laminia e l'ho caricata nella famiglia nidificata del pannello, dopodiché ho assemblato le flange con i comandi Edit work plane, copy, move e la barra spaziatrice.
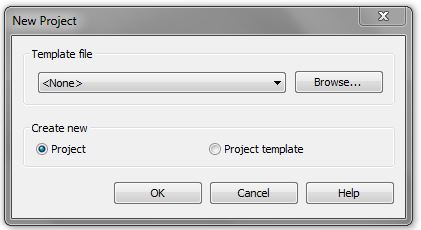
Una volta salvata anche questa famiglia occorre caricarla nel file di progetto. Ho aperto quindi new project>template:none>metric.
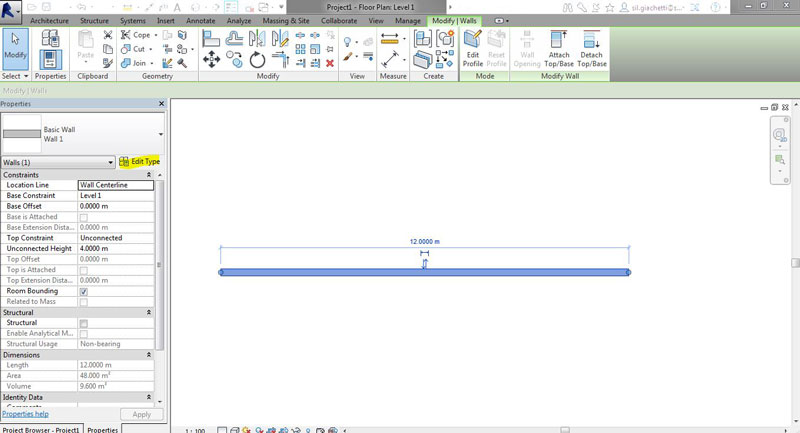
Per prima cosa ho cambiato le unità di misura del file da Menage>Project units e le ho covertite in metri. Dopodiché ho creato un muro tramite il comando Architecture>Wall>Architectural wall di cui ho poi ridefinito le dimensioni tramite le quote lineari. Ho poi ridefinito la natura del muro selezionandolo e andando a cliccare su Edit Type.
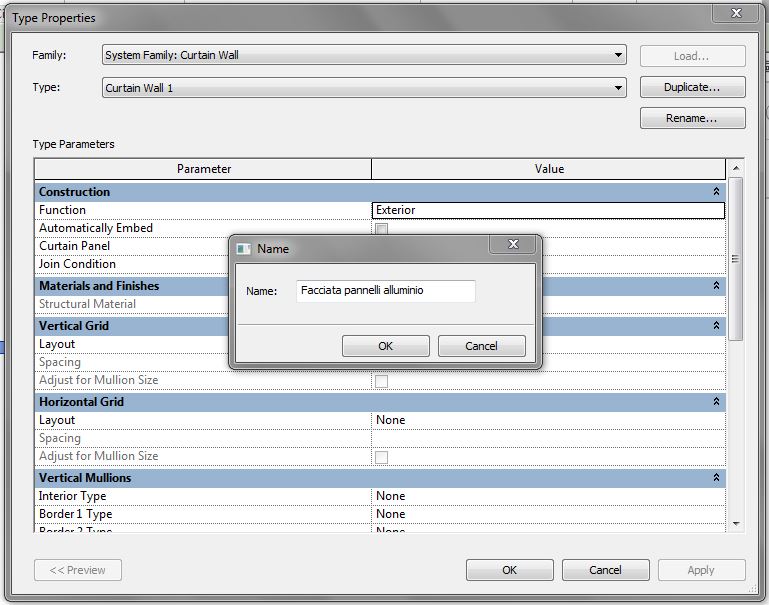
Da qua si apre una finestra in cui ho cambiato il System Family in Curtain Wall, dopodiché ho duplicato il tipo di muro e l'ho rinominato.
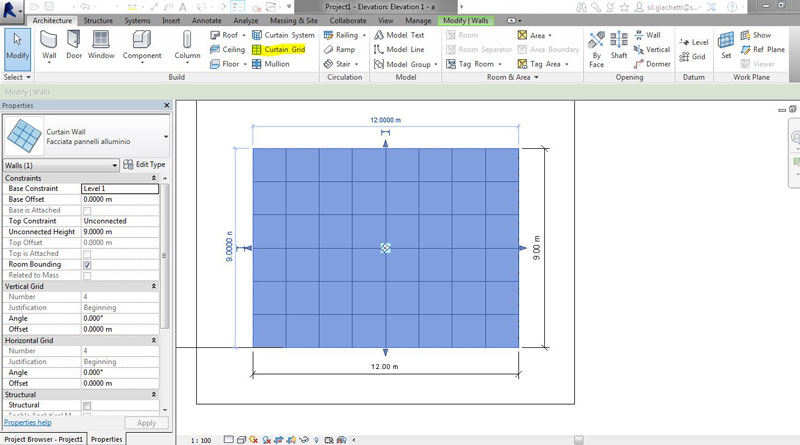
Dalla vista Elevation 1-a, creata dal menù View>Elevation, con il comando Curtain Grid ho tracciato la griglia da 1,5mx1,5m in cui inserire il pannello.
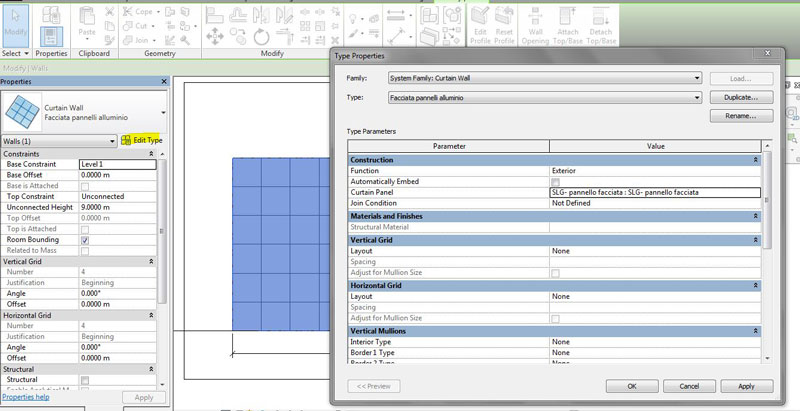
Infine ho caricato il pannello nel file di progetto e l'ho assegnato alla Curtain Wall andando a modificare da edit type> type properties la voce Curtain Panel.
In questa ipotesi ho dato per scontato che il sistema di fissaggio della lamina al telaio fosse interno e non visibile ma gli esempi che ho trovato non sono stati molto incoraggianti: ho provato quindi a ipottizare un fissaggio a bulloni.
Nella famiglia pannello ho tracciato dei piani di riferimento passanti per i punti medi delle lamine e in questi ho centrato le bucature del telaio.
Ho quindi modificato anche la famiglia lamina con gli stessi criteri: ho creato un nuovo parametro a cui ho assegnato una formula per avere il foro sempre centrato nel mezzo.
Ho quindi ricaricato la famiglia figlia nella famiglia madre e ho aperto new family>metric generic model face based per il bullone che ho semplificato con due estrusioni cilidriche. Dopodiché ho caricato anche questa famiglia nella famiglia pannello e ho posizionato gli elementi.
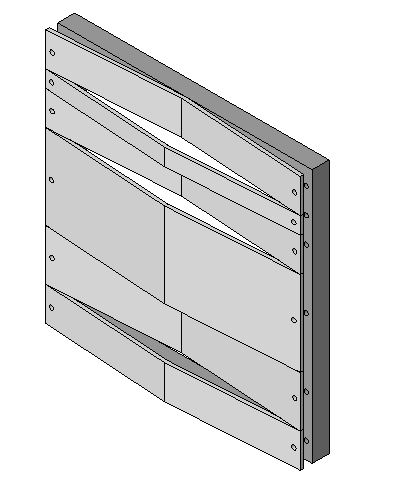
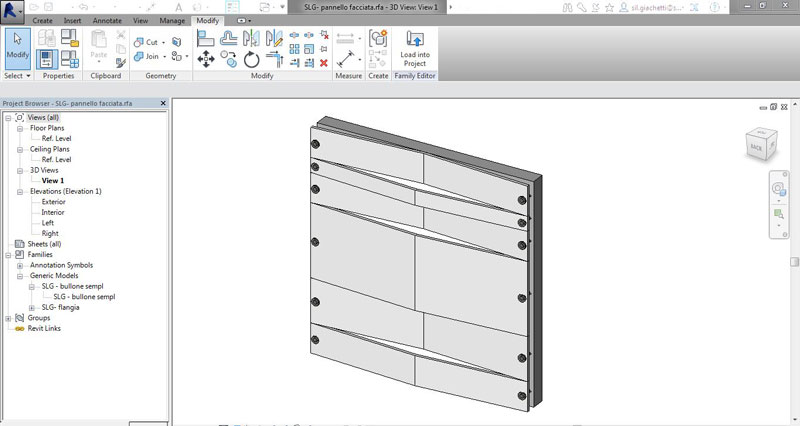
Dopodiché ho semplicemente ricaricato la famiglia pannello nel progetto che si è subito aggiornato.
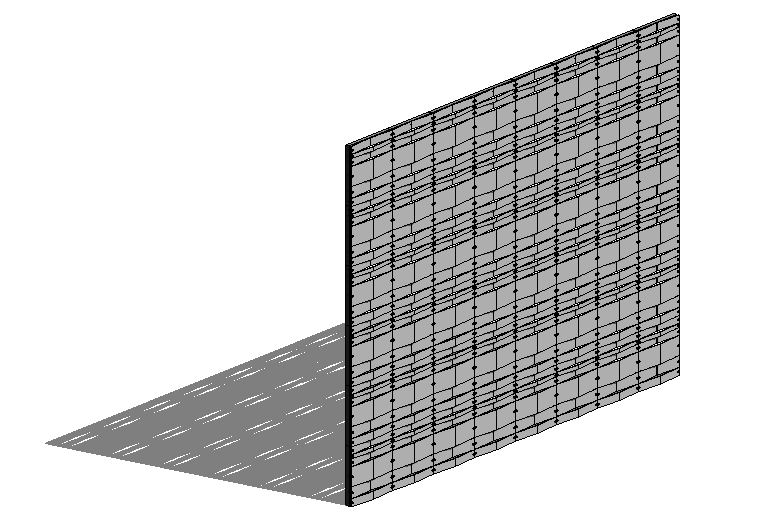
Mi aspettavo una soluzione più "morbida" dove pravalesse l'orditura orizzontale degli elementi. Probabilmente per ottenere qualcosa del genere sarebbe stato più indicato usare un tipo di telaio diverso e delle lamine più lunghe: forse in quel caso anche il sistema di fissaggio sarebbe stato meno invasivo.
Mar, 06/01/2015 - 14:13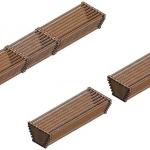 silvia giachetti
Lun, 05/01/2015 - 18:44
silvia giachetti
Lun, 05/01/2015 - 18:44
Ciao a tutti e buon anno!
Innanzitutto mi scuso per il ritardo con cui posto questa consegna e la successiva...ma meglio tardi che mai!
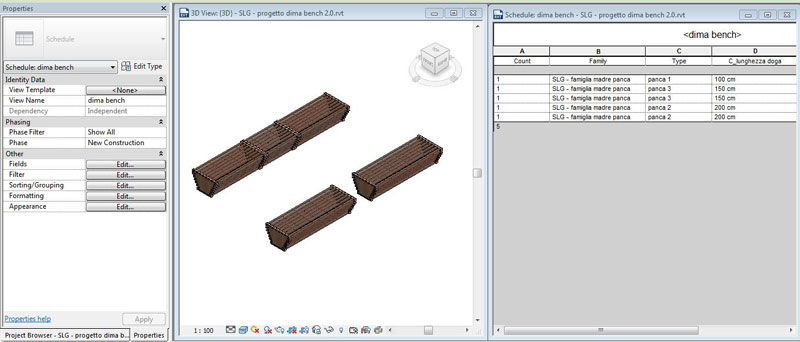
Per questa consegna ripropongo il modello dell'esercitazione precedente con qualche piccolo cambimento. Ho ricreato due famiglie figlie che ho poi assemblato in una famiglia madre. Successivamente ho importato quest'ultima famiglia in un file di progetto per poter creare una tabella, schedule, in cui vengono sintetizzati alcuni dati del progetto.
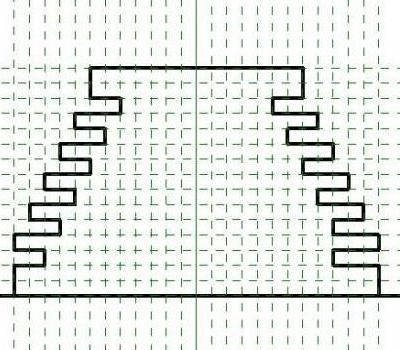
Per prima cosa ho creato una nuova famiglia per modellare la dima, precendendo dal menù principale New family>Metric generic model face based.
Ho tracciato con Crate>Reference Plane i piani di riferimento "estremi" della dima e poi li ho duplicati con il comando Array definendo il numero dei piani e la distanza in cui andavano tracciati.
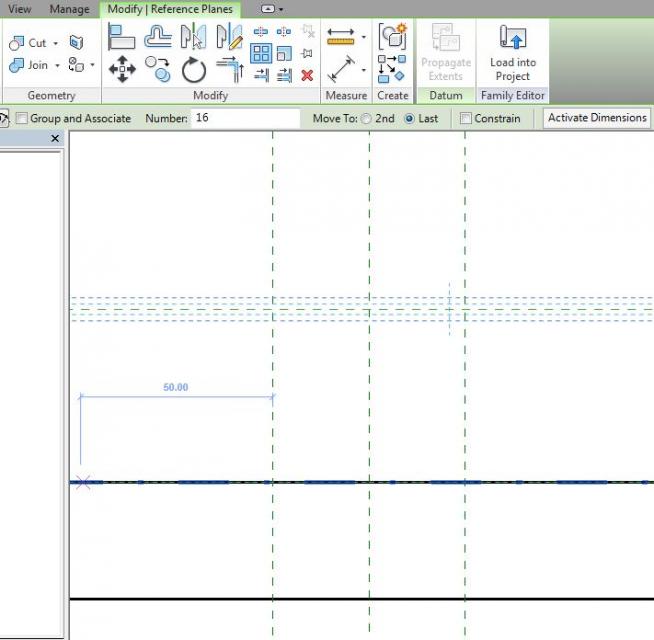
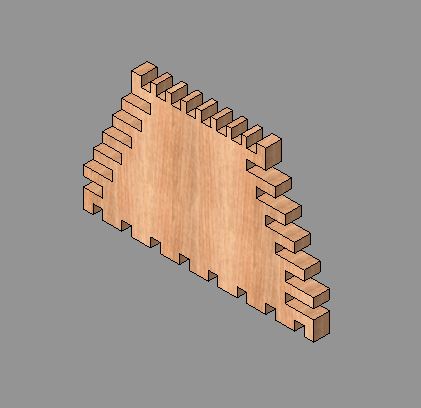
Con Create>Extrusion ho tracciato in vista Front il profilo della dima che ho successivamente modificato con il comando Create>Void Extrusion.
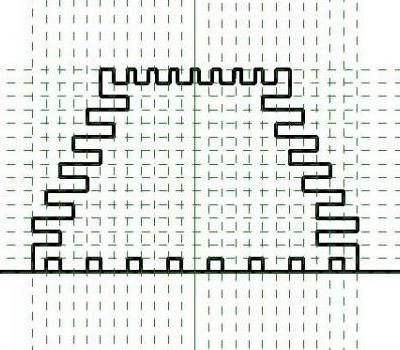
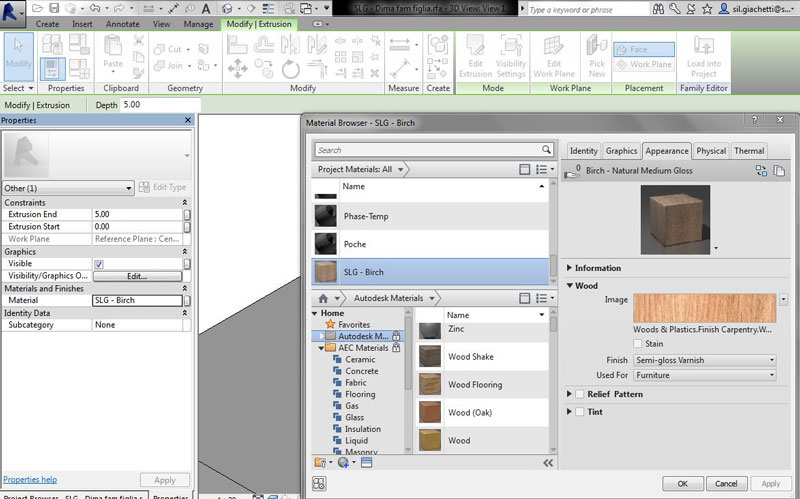
Una volta dimensionato anche lo spessore, ho assegnato un parametro materiale all'oggetto da selezione>properties. Nel Material Browser ho caricato e duplicato il materiale scelto andandolo poi a rinominare.
Salvata la prima famiglia figlia, ho continuato creando la famiglia figlia "doga" procedendo sempre nella stessa maniera: new family>metric generic model face based.
Ho disegnato un semplice parallelepipedo con Create>Extrusion>Rectangular, a cui ho poi assegnato dei parametri dimensionali tramite le quote lineari.
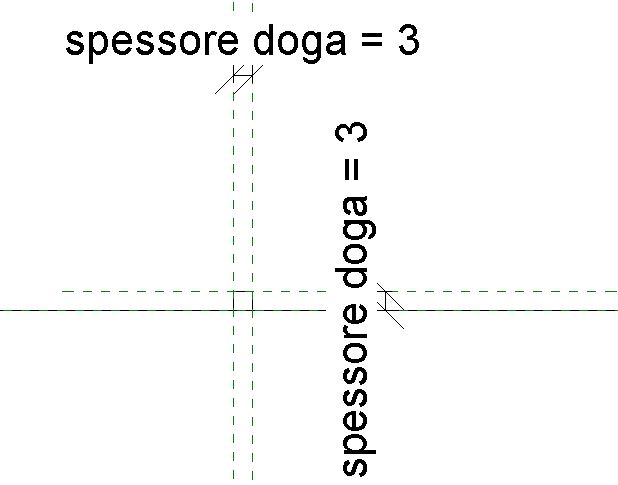
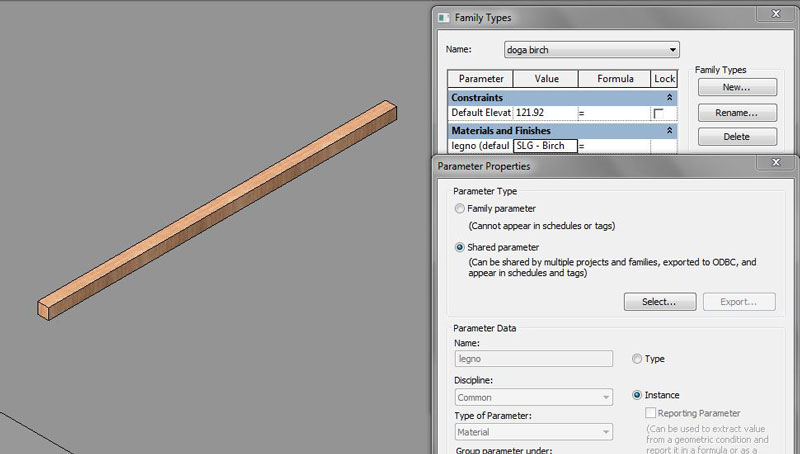
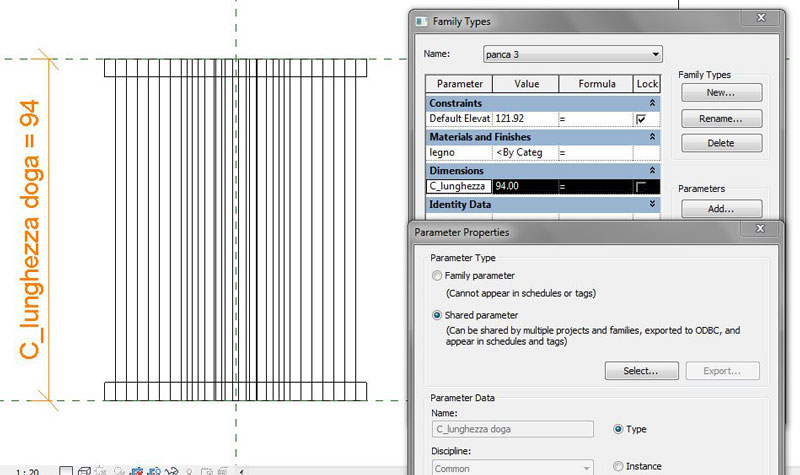
Ho definito quindi il paramatro materile con il metodo precedentemente usato, andandolo poi a modificare dal comando family types.
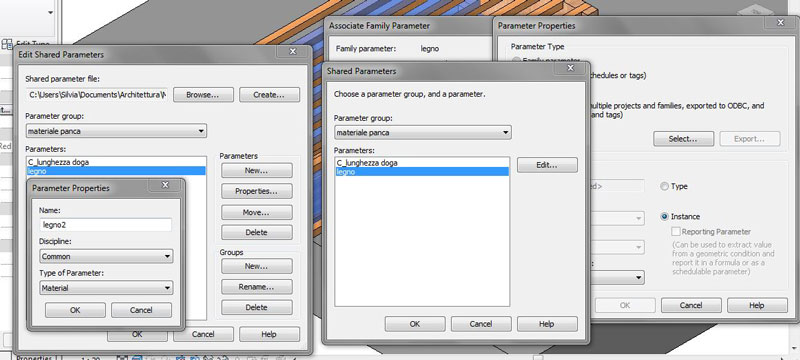
Inizialmente avevo definito il parametro materiale "legno" come paramentro condiviso (shared) di tipo e da qui avevo formato 2 tipi di famiglia; una volta entrata nella famiglia madre non riuscivo però ad associare il tipo di doga al tipo panchina per cui dopo vari tentativi ho cambiato strada e ho ridefinito il parametro materiale condiviso di istanza.
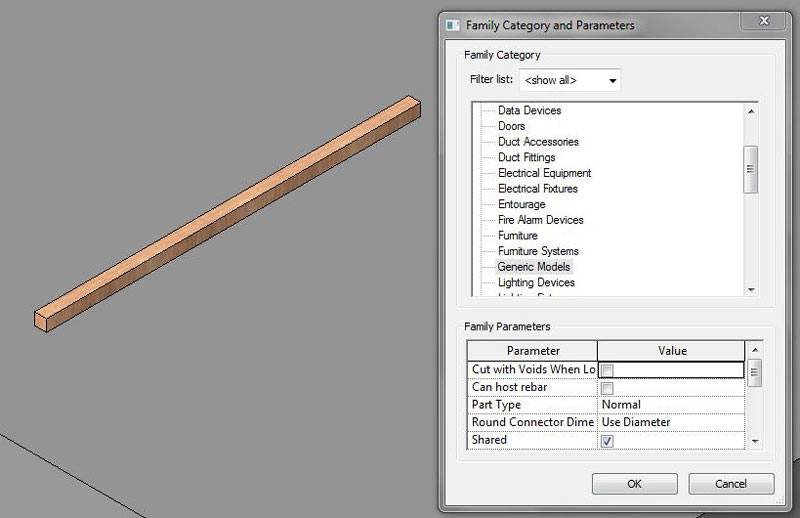
Prima di salvare e caricare la dago nella famiglia madre occorre spuntare l'opzione "shared" nella finestra Family categories and parameters per permettere la condivisione dei parametri.
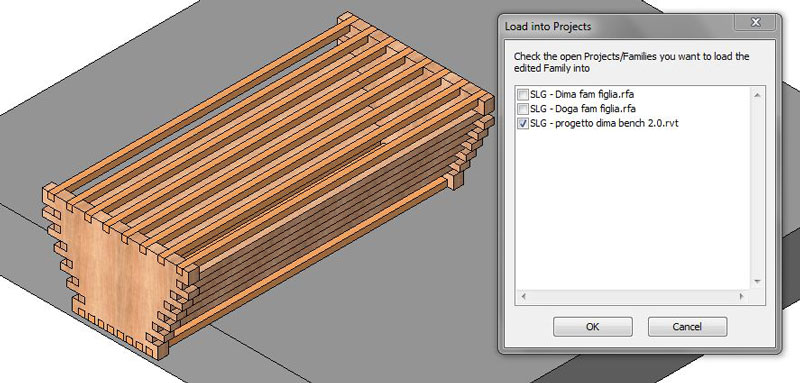
Completate le due famiglie figlie, ho creato la famiglia madre in cui ho assemblato i componenti del progetto. Ho creato quindi una nuova famiglia>metric generic model face based in cui ho caricato le due famiglie. Ho quindi posizionato e assemblato i componenti tramite i comandi Place on work plane, Edit work plane, Copy e Move.
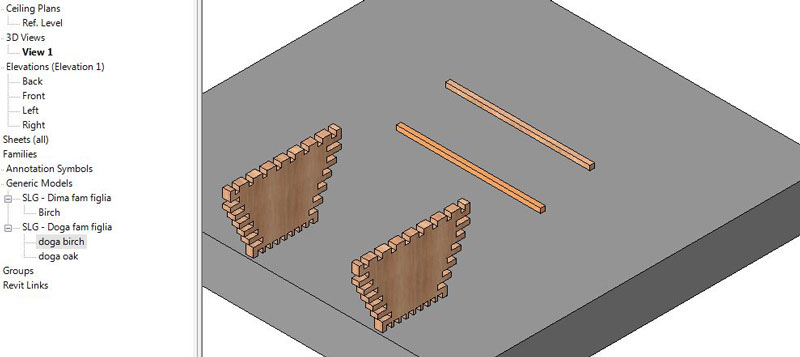
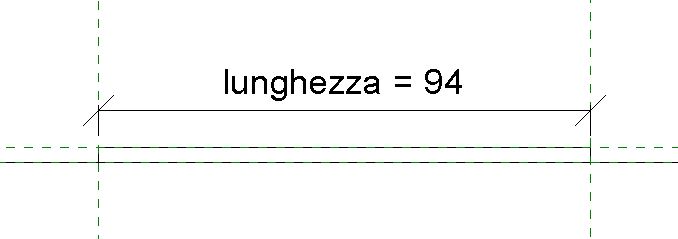
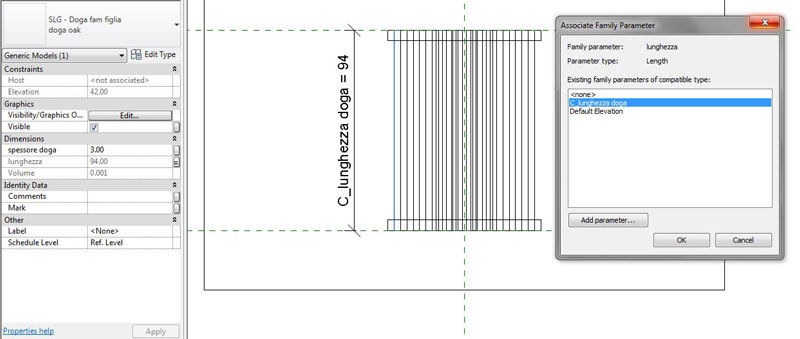
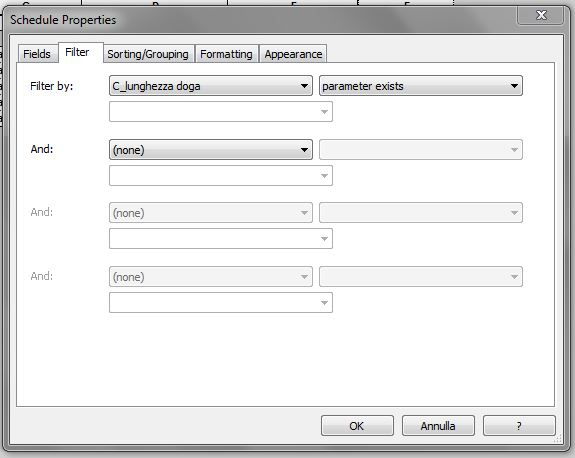
Una volta ricomposta la panchina ho tracciato dei piani di riferimento a cui ho allineato (Align) le componenti del progetto. Ho potuto quindi definire il parametro condiviso "C_lunghezza doga" a cui ho associato il parametro "lunghezza" della famiglia doga: in questo modo ho ottenuto la corrispondenza tra la lunghezza delle doghe e quella complessiva dalla panchina.
Per associare parametri di famiglie diverse occorre selezionare l'oggetto (o gli oggetti) nella famiglia madre e andare nel menù properties: da qui si può associare il parametro della famiglia figlia a quello della famiglia madre cliccando sul tasto a destra nella barra menù delle properties.
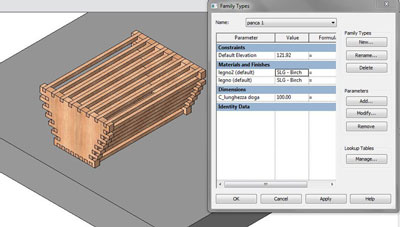
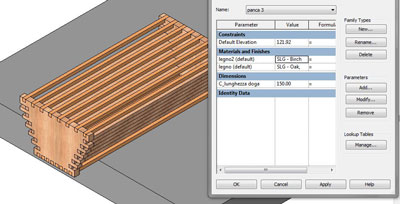
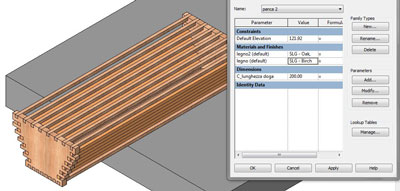
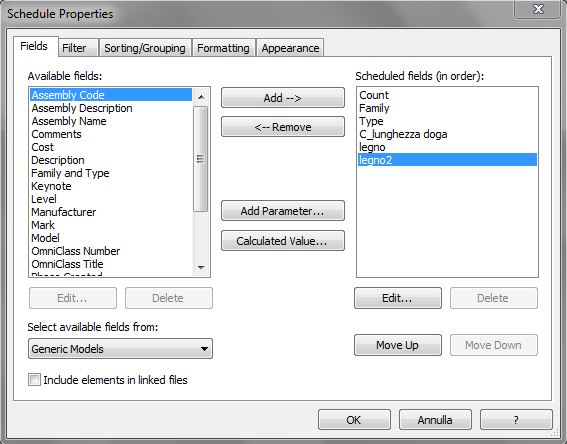
Ho definito quindi 3 tipi di panchine variando la loro lunghezza (1 m, 1,5 m, 2 m). Per avere maggiori varizioni tra le tre tipologie ho associato a ogni tipo di panchina delle combinazioni di materiale diverso, facendo variare il materiale delle doghe dei lati inclinati rispetto a quello delle doghe "rette".
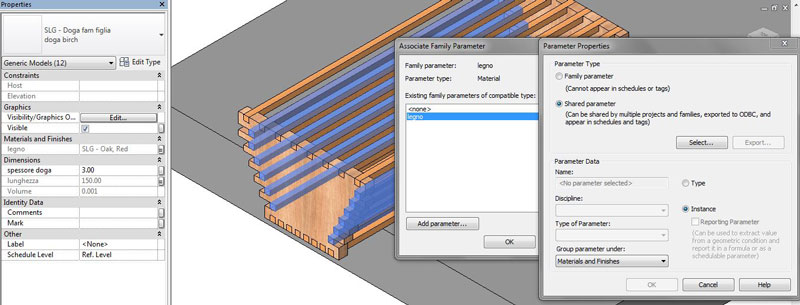
Ho quindi creato 2 parametri materiale condivisi nella famiglia madre, legno e legno2, e a questi ho associato il parametro materiale della famiglia "doga", selezionando però una volta il gruppo delle doghe "laterali" e l'altra il gruppo delle doghe "rette".
Dopodiché ho caricato la famiglia nel progetto che avevo creato tramite New project>Template:none>Metric
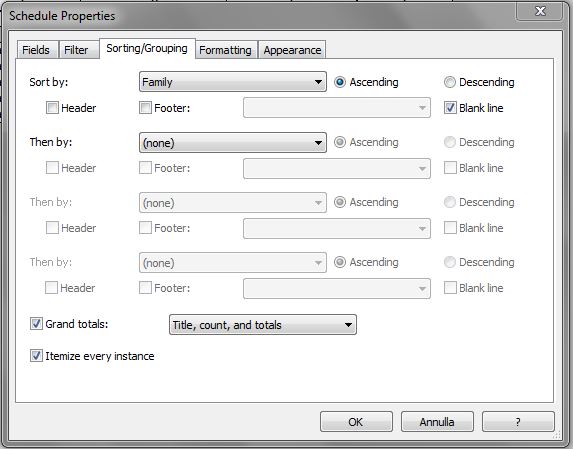
Dopo aver definito la posizione e il tipo di panchina posso creare la Schedule tramite View>Create>Schedules.
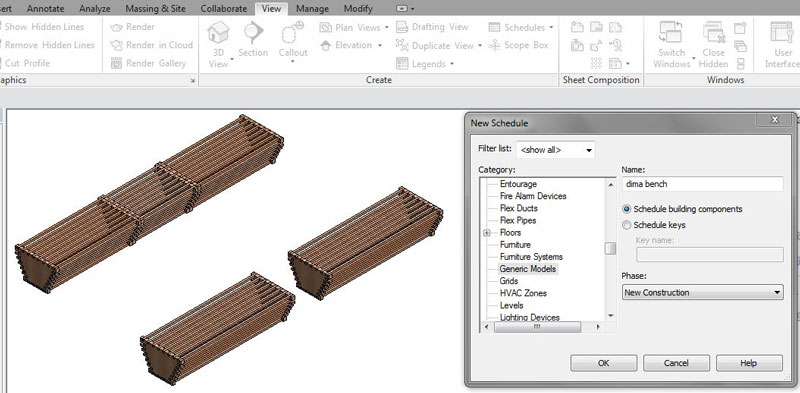
Dopo aver definito la categoria e nominato la nuova schedule occorre definire quali sono i dati che vogliamo estrapolare e come li vogliamo mostrare: tutte queste operazioni vengono gestite tramite le schedule properties.
Lun, 05/01/2015 - 18:47
 andrea piattella
Dom, 04/01/2015 - 15:10
andrea piattella
Dom, 04/01/2015 - 15:10
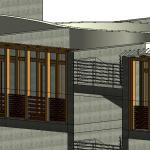
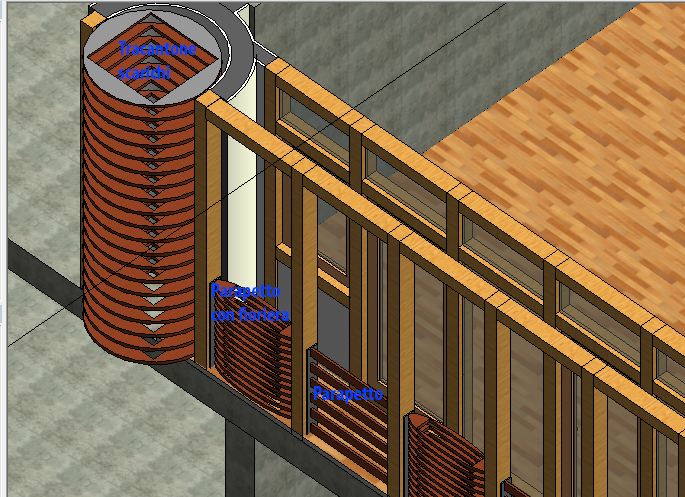
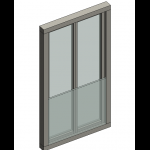
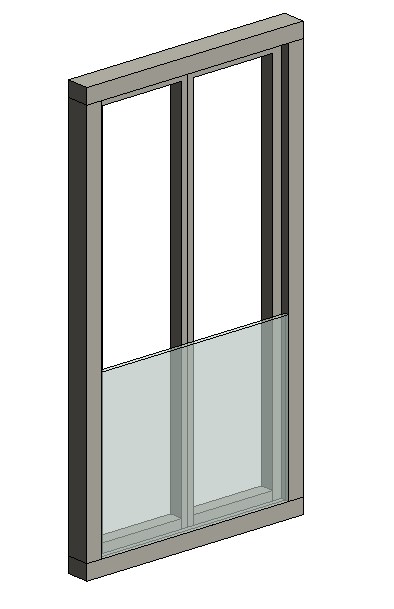
I designed the first component for the CURTAIN WINDOW for the Ligini's building.
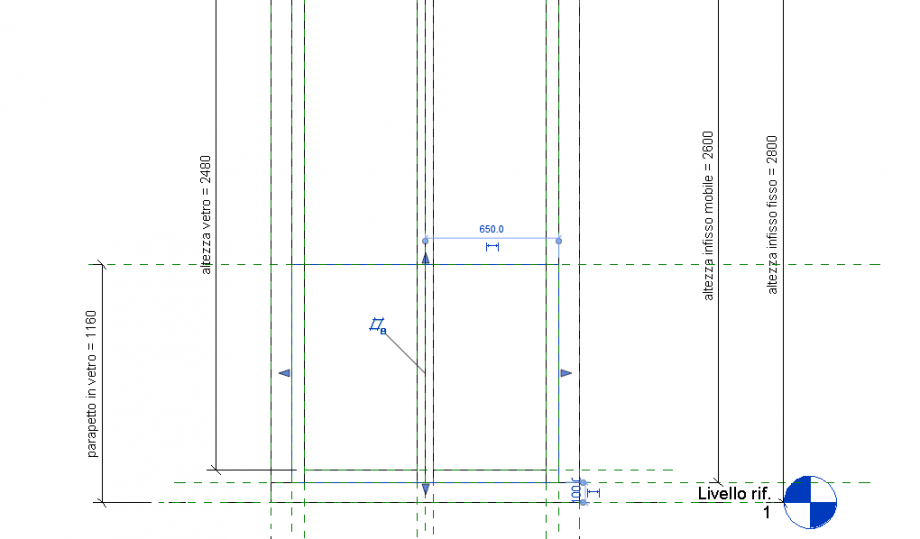
I decided to make an element composed of an opening window and a glass parapet.
To start I opened a new family - CURTAIN WINDOW
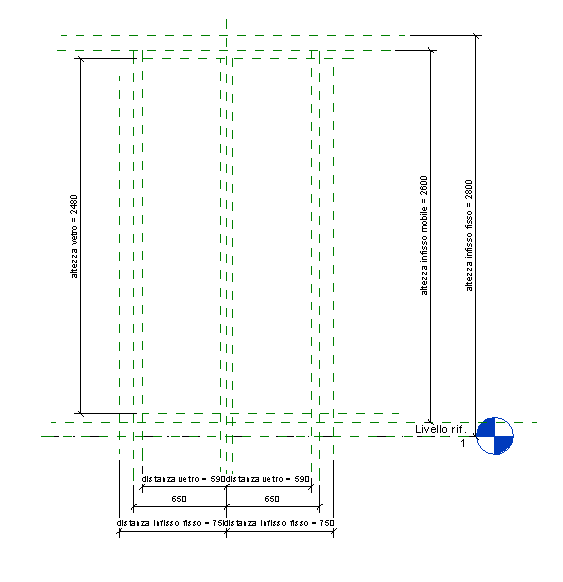
Then with the REFERENCE PLANE I traced the edge lines of the fixed frame and of the mobile frame.
through the ALIGNED DIMENSION I quoted each part of the Window.
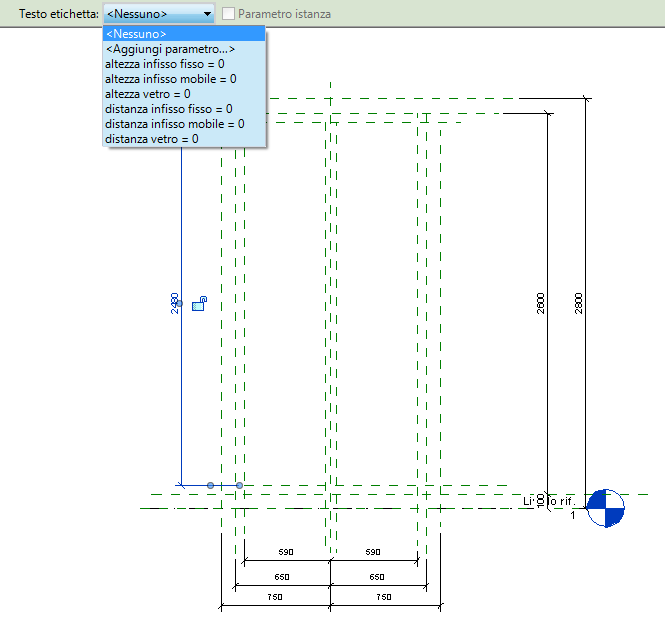
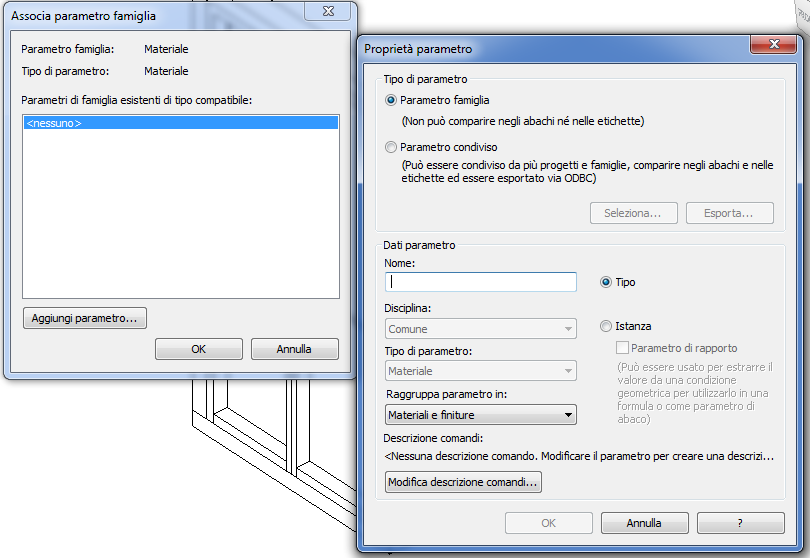
Once I finished I created new parameters: FAMILY TIPES - add - I assigned a name to this new one parameters - OK
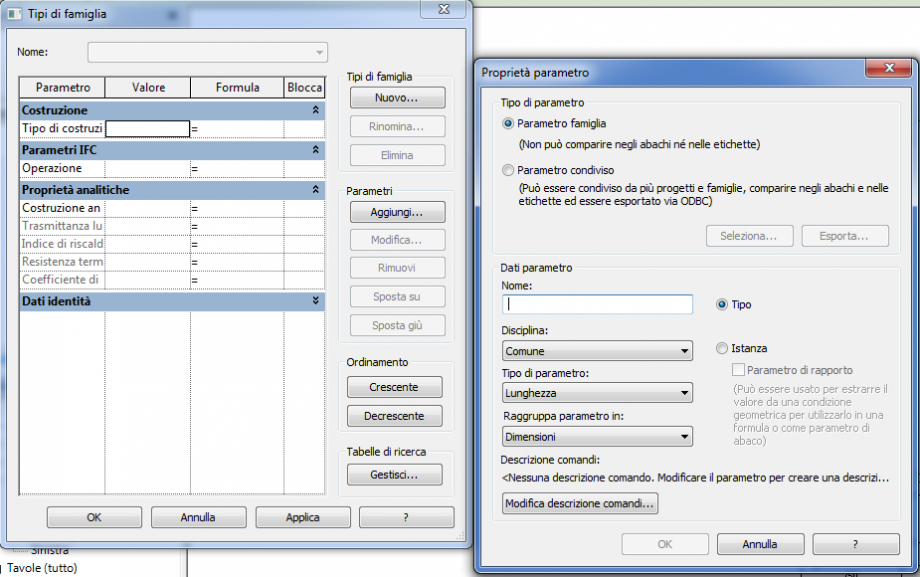
To assign the new parameters to the aligned dimension I selected them - LABEL - and then I selected the parameters that I needed
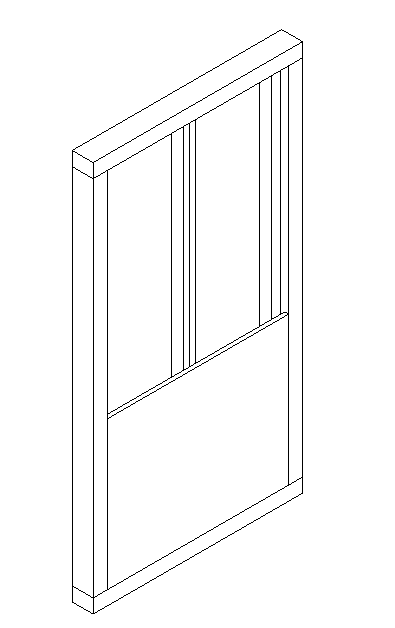
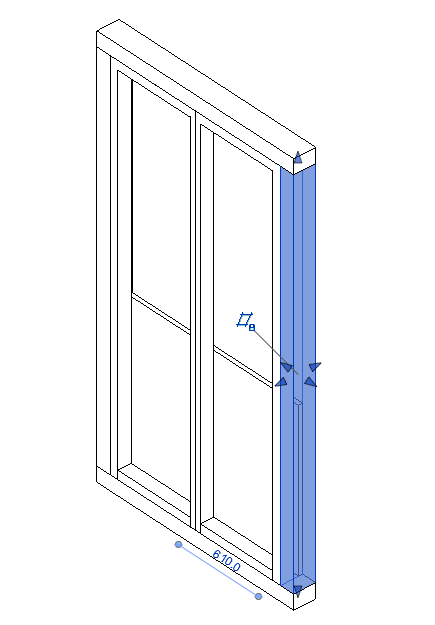
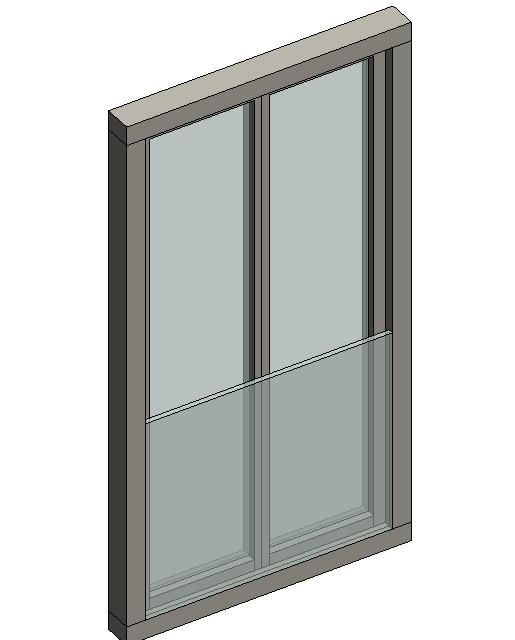
Then trough the command EXTRUSION I extruted the fixed frame in the front elevation. Once I finished I changed view to assigned a depht to the frame.
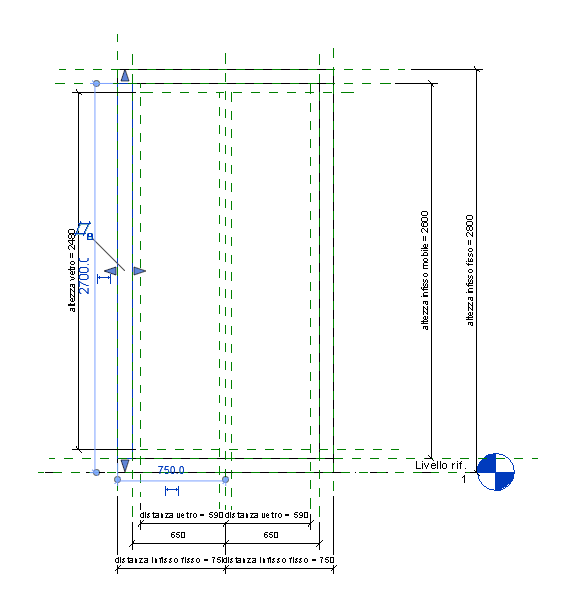
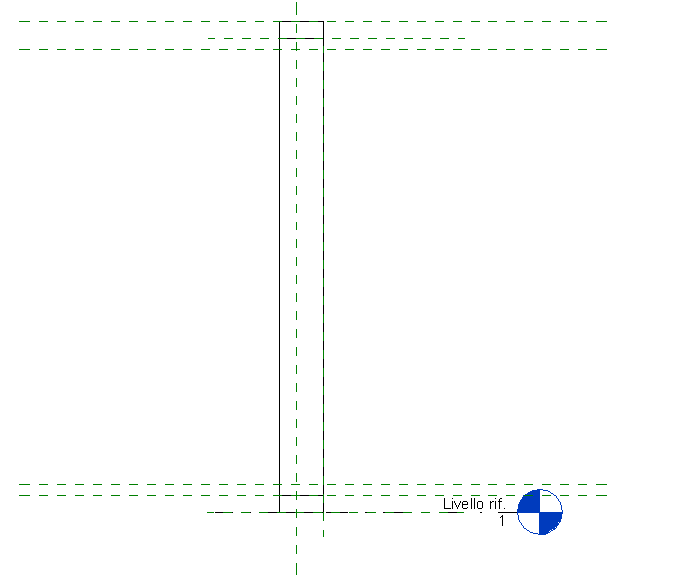
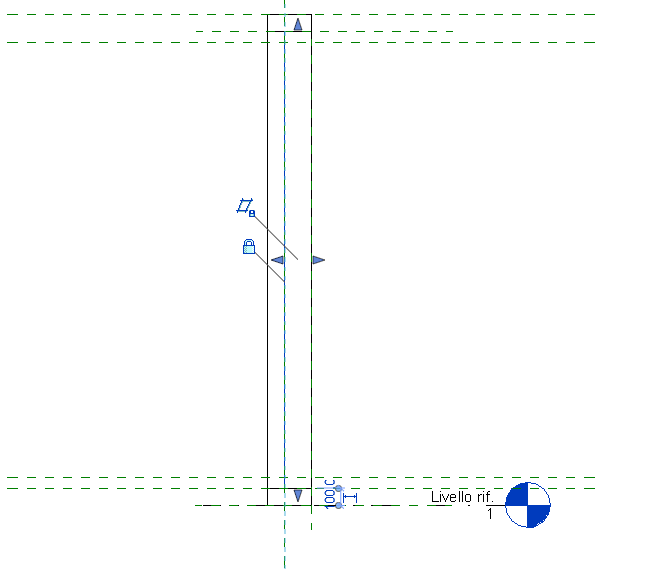
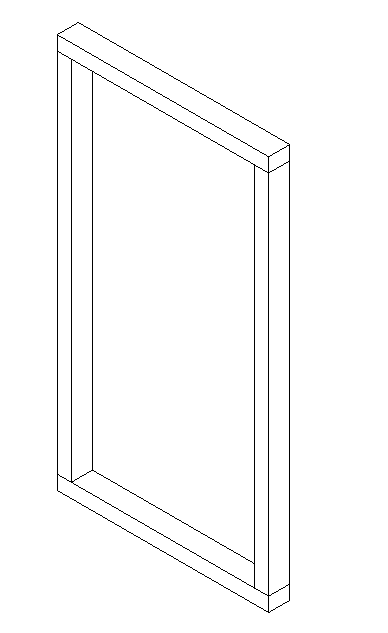
Once I finished with the fixed frame I started with the mobile frame. As before I extruded the frame in the frontal view with the command EXTRUSION and then I assigned to it a depth in the side view.
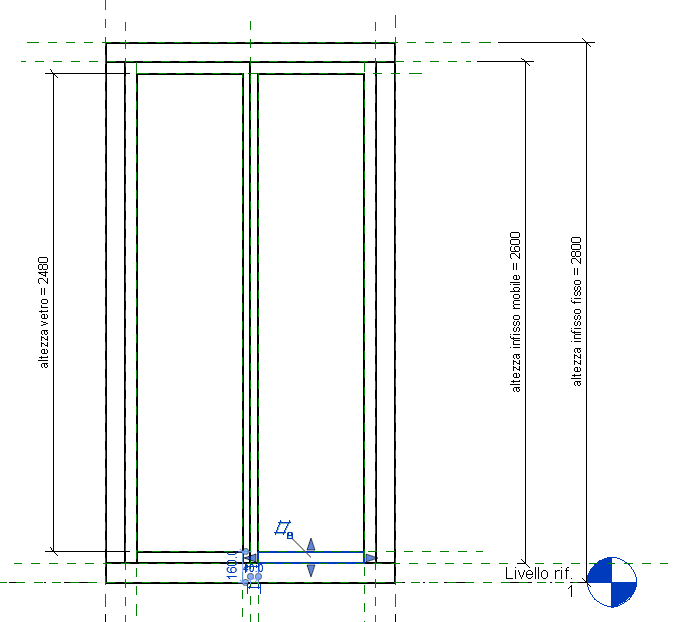
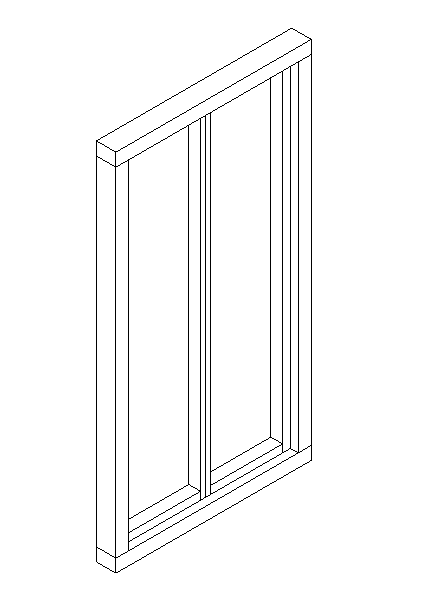
Now to make the glass parapet I did the same steps that I did for the frames. 1_ I created the edge lines through the REFERENCE PLANE 2_I created a new parameter that I assigned to the aligned dimension 3_I extruted the glass and then modified the thickness in the side view
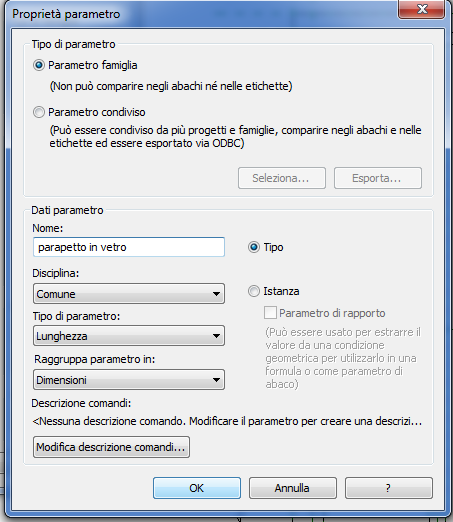
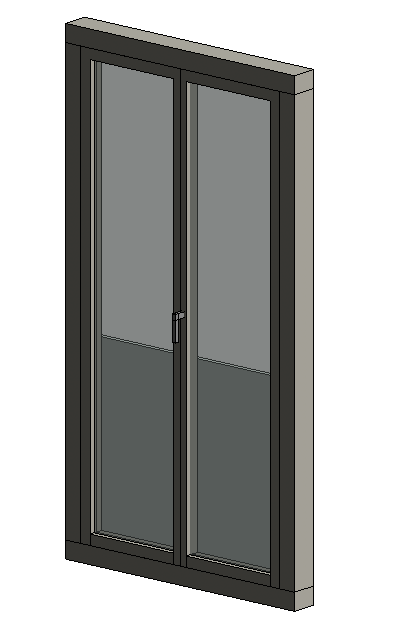
To assigned the materials I selected each part of the window and created for them a new parameter to wich corrisponded a specific material.
 eri.agnelli
Ven, 02/01/2015 - 18:43
eri.agnelli
Ven, 02/01/2015 - 18:43
Buon anno a tutti!
Vorrei condividere con voi delle suggestioni riguardo al tema di progetto, il quale mi ha riportato alla mente queste pagine di un libro particolarmente importante per la mia formazione.
Da Delirious New York, Rem Koolhaas:
"Scisma Non è ammessa nessuna infiltrazione di simbolismo tra i vari piani. Infatti, la disposizione schizoide di piani tematici implica una strategia architettonica capace di pianificare l'interno del grattacielo, che ora è diventato autonomo attraverso la lobotomia: lo Scisma Verticale, uno sfruttamento sistematico della sconnessione intenzionale tra i vari piani.
Negando la reciproca dipendenza dei piani fra loro, lo Scisma Verticale ne ammette la distribuzione arbitraria all'interno del singolo edificio. E' una strategia essenziale per lo sviluppo del potenziale culturale del Grattacielo: essa accetta l'instabilità di una composizione definitiva del Grattacielo al di là di un singolo piano e, al tempo stesso, la neutralizza attraverso l'inserimento di ogni destinazione d'uso conosciuta con la massima specificità, se non addirittura con determinazione assoluta."
(...)
"La riproduzione del mondo. Nell'era delle scale tutti i piani superiori al secondo erano considerati inadatti agli scopi commerciali e, oltre al quinto, inabitabili.
A partire dal 1870, a Manhattan, l'ascensore diventa il grande emancipatore delle superfici orizzontali situate oltre il pianterreno.
L'invenzione di Otis recupera gli innumerevoli piani che hanno galleggiato nell'aria sottile della speculazione e ne rivela la superiorità attraverso un paradosso metropolitano: maggiore è la distanza da terra, più si fa stretto il rapporto con ciò che rimane della natura (natura e aria).
L'ascensore è l'ultima profezia auto-appagante: più sale, meno desiderabile risulta ciò che si lascia alle spalle.
Esso stabilisce inoltre una diretta relazione tra ripetizione e qualità architettonica: maggiore è il numero di piani che si ergono intorno al piano ascensore, più spontaneamente questi si materializzano in una singola forma. L'ascensore da luogo alla prima estetica fondata sull'assenza di articolazione.
Verso il 1880 all'ascensore viene abbinata la struttura portante metallica, in grado di sostenere i territori recentemente scoperti senza occuparne lo spazio.
Attraverso il mutuo rafforzamento di queste due conquiste tecnologiche, ogni sito può ora essere moltiplicato per un numero all'infinito, dando luogo a quella proliferazione di superfici calpestabili chiamata Grattacielo.
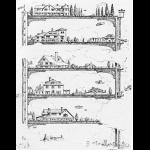
Teorema. Nel 1909 la promessa rinascita del mondo, annunciata dalla Globe Tower, raggiunge Manhattan sotto forma di un'illustrazione che è in realtà un teorema che descrive la prestazione ideale del grattacielo: un'esile struttura metallica che sorregge 84 piani orizzontali, tutti aventi le medesime dimensioni del lotto.
Ognuno di questi livelli artiificiali è trattato come un territorio vergine, come se tutti gli altri non esistessero, in modo da creare un regno strettamente privato attorno a una casa di campagna isolata e ai suoi servizi accessori, stalla, alloggi della servitù, ecc.
Le ville sulle 84 piattaforme, pur essendo sorrette dalla struttura in maniera assolutamente neutrale, dispiegano un campionario di aspirazioni sociali che vanno dal rustico al monumentale; le enfatiche permutazioni degli stili architettonici, le variazioni nei giardini, ni gazebo, e così via, creano a ogni fermata dell'ascensore uno stile di vita completamente differente, dotato di una propria ideologia implicita."

(...)
"La sconnessione di questi lotti aerei entra apparentemente in conflitto con il fatto che, assieme, essi formano un unico edificio. Inoltre, il disegno mostra chiaramente come la struttura sia completa solo nella misura in cui l'individualità delle piattaforme viene preservata e sfruttata, e come il suo successo vada misurato sulla base della capacità della struttura di ordinare la loro coesistenza senza interferire con i loro destini. L'edificio diventa così un conglomerato di esistenza private. Solo 5 delle 84 piattaforme sono visibili; più in basso, tra le nubi, altre attività occupano i lotti rimanenti; non è possibile conoscere la funzione assegnata a ogni singola piattaforma prima della sua costruzione, le ville potrebbero essere costruite o demolite, e altre strutture potrebbero sostituirle, ma ciò non avrebbe alcun effetto sulla struttura principale."
(...)
"Alibi. Lo scheletro del teorema del 1909 definisce il Grattacielo di Manhattan come una formula utopica per la creazione illimitata di territori vergini su un unico lotto urbano."
Ven, 02/01/2015 - 20:17